UV-Vis Spectrophotometric Sensors for Wastewater Treatment Process Monitoring
(Updated Nov., 2025)
Monitoring wastewater characteristics is critical for the effective management of a water resource recovery facility (WRRF). Laboratory measurement of grab or composite samples is the dominant method of compliance monitoring. However, process monitoring is increasingly being done with measurements from online analytical instrumentation. Continuous monitoring improves decision-making and reduces the burden on staff for sampling and measuring process parameters multiple times per day. The information allows managers to minimize inputs of chemicals and energy and avoid conditions leading to process upsets. The selection and reliability of sensor technology have improved substantially in the last decade. For example, sensors based on spectrophotometry are now available for direct measurement of important parameters without using costly reagents that need replenishing often.
The objective of this post is to provide guidance on the proper selection, commissioning, maintenance, operation, and application of sensors based on spectrophotometry for process monitoring of wastewater treatment. Many important substances in wastewater, including nitrate, nitrite, color, and organic carbon parameters, can be measured based on the absorption of UV and visible light (UV-Vis).
Below, we'll cover measuring principles, design, and operation of UV-Vis sensors which are part of the YSI IQ SensorNet process monitoring system. The concepts presented are also applicable to other major brands although the design and operation of the sensors are specific to each brand.
Wastewater Treatment Monitoring
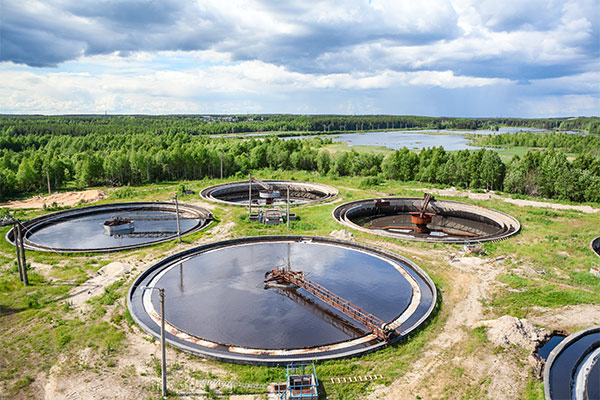
Monitoring wastewater treatment is critical to verify the quality of effluent after each stage of the process and to assess treatment efficiency. Municipal WRRFs predominantly employ activated sludge treatment technology. (Learn more, How to Control Activated Sludge with Online Sensors). Activated sludge is a biological process in which dissolved and particulate pollutants are removed by transforming organic carbon into carbon dioxide (CO₂) and, if modifications for nitrogen removal are employed, ammonia nitrogen into nitrogen gas (N₂). The most common analytical parameters used in the United States to quantify organic content are BOD (biochemical oxygen demand) and COD (chemical oxygen demand). BOD and COD are sum parameters of many different substances which would require considerable analytical effort to identify individually. BOD and COD are measurements of the amount of oxygen required to oxidize organic carbon in the sample. The units of measurement are mg O₂/L.
In the case of BOD, the reaction is catalyzed by bacteria. Besides the fact that the test is confined to the lab on account of the precise conditions required for the long (5-day) incubation, the method is very sensitive to technique and so the precision may be questionable. (Learn more, BOD Testing Accuracy and Success - Are You Achieving This?). COD methods are more aggressive chemical oxidations such that nearly all organic carbon is oxidized. It is faster than BOD but very expensive to implement in an online analyzer because of the requirement for sample collection, sample preparation equipment and replenishment of reagents. (Learn more, Chemical Oxygen Demand in Influent Wastewater Monitoring).
Total organic carbon (TOC) is less frequently used but is gaining traction as a supplement or even replacement for BOD in process control. TOC methods are a direct measurement of organic carbon in the sample; the units of measurement are mg C/L. TOC measurement is faster and simpler than BOD or COD and doesn’t require mercury, like COD methods. TOC measurements may also be more precise, particularly for samples with very low organic content such as in the effluent from an advanced WRRF. Sampling and sample prep are required for online TOC analysis.
The sufficient removal of nitrogen from wastewater has become increasingly important. Nitrogen is a critical macronutrient that supports the growth of living organisms including algae. In waters enriched with nutrients, algae growth and death can be accelerated leading to hypoxia, a low oxygen condition unsuitable for fish and other aquatic life forms. Treated wastewater is a significant source of nutrients in some watersheds. Monitoring and control of all nitrogen species is therefore of intense interest. Nitrate and nitrite in untreated wastewater is typically negligible. Therefore, the occurrence of either in treated wastewater is a result of biological nitrification which converts ammonia in wastewater to nitrate as shown in the diagram in Figure 1.
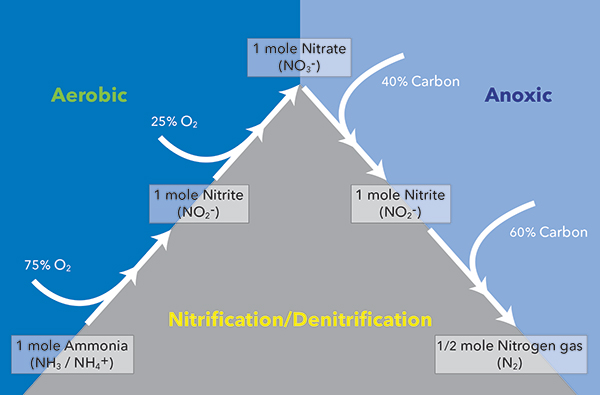
Figure 1. Nitrification and denitrification pathway diagram
Maximum nitrate concentration is achieved with complete and efficient nitrification. The sum of nitrite and nitrate, collectively termed NOx are converted to nitrogen gas and removed from wastewater by another biological reaction known as denitrification (Figure 1). This can be a good thing for WRRFs if it occurs in aeration tanks because it will reduce the total nitrogen (TN) in treated effluent and reduce the required energy intensity as this reaction is achieved without oxygen input. It would be a bad thing, though, if denitrification occurs in the sludge blanket of final settling tanks. The nitrogen gas bubbles produced can float solids interfering with the control of sludge recirculation and increasing total suspended solids (TSS) and BOD in treated effluent when solids escape over the weir, possibly causing a discharge permit violation. (Learn more, Total Suspended Solids Monitoring for Process Stability).
Process limitations in either nitrification or denitrification can cause nitrite accumulation and even more compliance issues. Facilities with chlorine disinfection will immediately notice an increase in chlorine demand because 1 mg/L of nitrite-nitrogen consumes 5 mg/L of chlorine. Failure to keep up chlorine dosing leads to insufficient disinfection and discharge of increased levels of bacteria in the treated effluent. Other effects may be more subtle but equally problematic. Nitrite is very toxic to aquatic organisms, more so than nitrate. 1 mg/L or more of nitrite-nitrogen can cause failure of a whole effluent toxicity (WET) test. The effects of increased levels of nitrite-nitrogen don't stop there. (Learn more, Chlorine Disinfection Control in Wastewater with Online Instrumentation).
In a bizarre twist, the bacteria that produce it and consume it, collectively the nitrifiers, are sensitive to nitrite creating a devastating feedback loop in which a small disturbance can cause a nitrification death spiral and a process upset leading to an extended period of non-compliance with effluent ammonia limits. On the other hand, nitrite accumulation can be exploited to improve wastewater treatment efficiency. The understanding and development of the nitrite shunt has fueled the development of innovative processes that deliberately shortcut nitrogen removal through nitrite with the benefit of reduced energy and chemical costs, which are shown in figures 2 and 3.
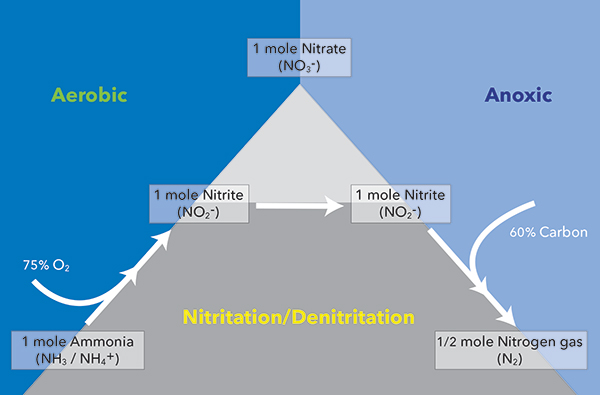
Figure 2. Nitritation and denitritation pathway diagram
Figure 3. Deammonification pathway diagram
Forms of nitrogen can be measured by many different methods including ion chromatography, colorimetry, and potentiometry. Chromatography is very precise but is limited to laboratory applications. Colorimetry also provides a high-quality measurement but requires ancillary equipment for sampling and sample preparation and reagents need replenishing. Potentiometry is reagentless and relatively inexpensive but electrodes drift requiring periodic recalibration and eventually need replacing altogether. Alternatively, organic carbon, nitrate, and nitrite can also be detected quickly and directly without the use of reagents by measuring the penetration of ultraviolet (UV) and visible light through a sample using the principle of UV-Vis spectrophotometry.
Spectrophotometry
Some basic knowledge of electromagnetic radiation (EMR) is helpful in order to understand the application of spectrophotometry for wastewater monitoring. The earth is bathed in EMR, a form of energy. The forms of EMR are distinguished by wavelength as described by the electromagnetic spectrum shown in Figure 4. Wavelength and energy are inversely proportional such that EMR at a relatively high wavelength is relatively low energy and vice versa. High-energy cosmic rays with a wavelength of one-one thousandth of a nm and lower are at one end of the spectrum and low-energy radio waves with a wavelength of 1 billion nm and higher are at the other end.
The various forms of EMR interact with materials in multiple different ways. For example, the warmth of the sun results from EMR in the infrared as defined by its wavelength. Spectrometry is the measurement of the interaction between EMR and materials. Spectrophotometry, a subset of spectrometry, is the measurement of the absorption or transmission of EMR (light) as a function of wavelength. When applied to the measurement of absorption in the wavelength range of 200 nm to 800 nm spanning ultraviolet radiation (UVR) and visible regions of the spectrum, it is referred to as UV-Vis spectrophotometry. The EMR-material interactions (absorption) in these ranges are dominated by relatively high energy promotion of electrons from a lower ground energy state to an excited higher energy state. The wavelength of UV or visible light absorbed depends on the ease of electron promotion which, in turn, depends on molecular structure and electron configuration. The question of which electron configurations cause absorption in the UV-Vis range has a complicated answer.
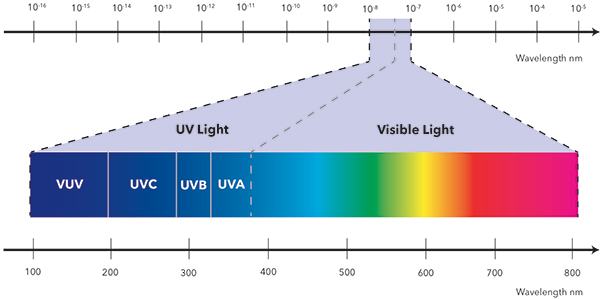
Figure 4. Electromagnetic spectrum
A few simple rules are helpful to understand:
- In wastewater samples absorbance in the long wavelength visible range (400 to 800 nm) is mostly caused by turbidity.
- Many organic molecules absorb most strongly in the UV wavelength range from 250 nm to 350 nm.
- Simple hydrocarbons, sugars, or alcohols are not detected but often these compounds occur in combination with other absorbing molecules which can be detected and correlated.
- Nitrate and nitrite absorb most strongly at short (< 250 nm) UV wavelengths.
It is also useful to understand that other EMR interactions are also significant, if not dominant, in the UV-Vis range. For this reason, absorption for any particular material occurs over a band of wavelengths and not any single discrete wavelength. Figure 5 shows the spectra, plots of absorbance versus wavelength, for standard solutions of nitrate and nitrite. Absorbance (A) is calculated as log Ιₒ/Ιwhere Ιₒis the initial light intensity and Ι is the intensity of light after it passes through the sample. The nitrate standard has a peak absorbance of around 200 nm but the “shoulder” region where significant absorbance occurs extends out to wavelengths above 230 nm. Furthermore, in a complex sample composed of many different materials, the spectra overlap.
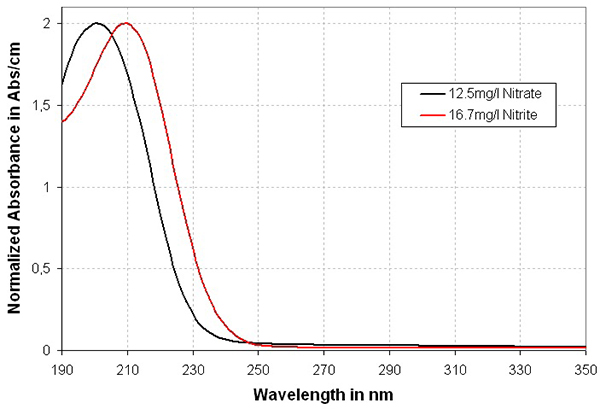
Figure 5. Spectrum for standard solutions of nitrate and nitrite (Franke, 2010)
The shape of the spectrum curve provides qualitative information, a fingerprint. The fingerprint will vary depending on the type of sample. Various sources of municipal wastewater are similar and are expected to express a similar fingerprint. Raw wastewater is often characterized by the presence of peaks at around 225 and 260 to 270 nm. The peaks are caused by surfactants and other organic compounds. Absorbance in the 320 to 350 nm regions is due to suspended solids. The absorbance values in the spectrum for treated wastewater are lower, reflecting the effect of degradation of organics and removal of suspended solids. The absorbance at the low wavelengths will depend on nitrogen transformation processes. Nitrifying facilities without subsequent nitrogen removal processes may show a higher absorbance on account of nitrate.
Spectrophotometry is also quantitative. Calculation of concentration from a measurement of absorbance is straightforward using the Lambert-Beer law which relates absorbance (A) to concentration (C) according to the equation, c = A/(ε×b). The absorptivity coefficient, ε, is a measure of how strongly a substance absorbs light of a given wavelength. The optical path length (b) depends on the design of the measurement system. Measurement of multiple wavelengths allows for a more comprehensive analysis of the sample. Multiple parameters can be monitored and interferences can be detected and compensated.
Spectrophotometry for Wastewater
Important wastewater parameters exhibit a distinguishable absorption of light in the UV-Vis range. Typical spectra of urban (municipal) wastewater and some of its constituents are shown in Figure 6. The spectrum for each pure substance may be considered a unique fingerprint. The spectrum for urban wastewater (the black line) is formed from the individual contributions of each component substance. Particles that cause turbidity may increase absorbance across the spectrum. (Learn more, Top 5 Questions When Selecting UV or UV-Vis Sensors).
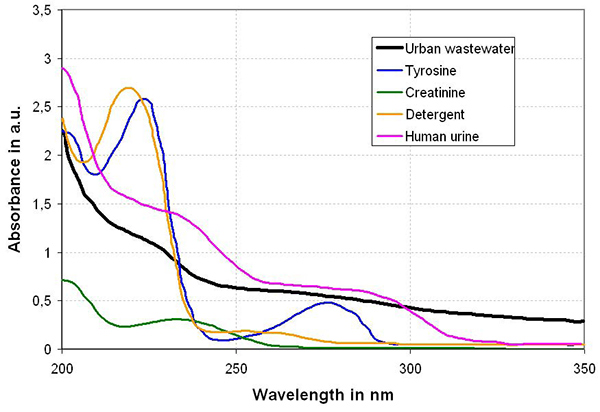
Figure 6. Typical spectra of municipal wastewater and its constituents (Pons, 2005)
Carbon Sum Parameters
Contamination from organic compounds can be detected due to absorption in the ultraviolet range from 200 nm to 400 nm. The SAC (spectral absorption coefficient) has been used for many years as an indication of the organic content of water samples. SAC is a direct measurement of the absorbance at a single specified wavelength, typically 254 nm. The less light transmitted across the 254 wavelength (i.e. the more light absorbed), the higher the value of SAC-254 and the more organic contamination in accordance with Lambert-Beer. The most common usage is for monitoring wastewater from industrial processes to detect transient spikes in organic contamination or to trend the organic content over time.
SAC-254 (UVT-254) can also be used to estimate the sum parameters COD, BOD, and TOC. User calibration is required for each application based on the correlation between the SAC value and laboratory reference measurements – a factory calibration is not possible. This approach may suffer from large errors and poor repeatability as demonstrated by the data in Figure 7 which is a comparison of SAC-correlated COD with COD measured according to laboratory reference methods. The data include numerous outliers with up to 300% error compared with laboratory reference measurements of COD. The cause of the errors is the inability of a single-wavelength measurement to track all changes in the sample.
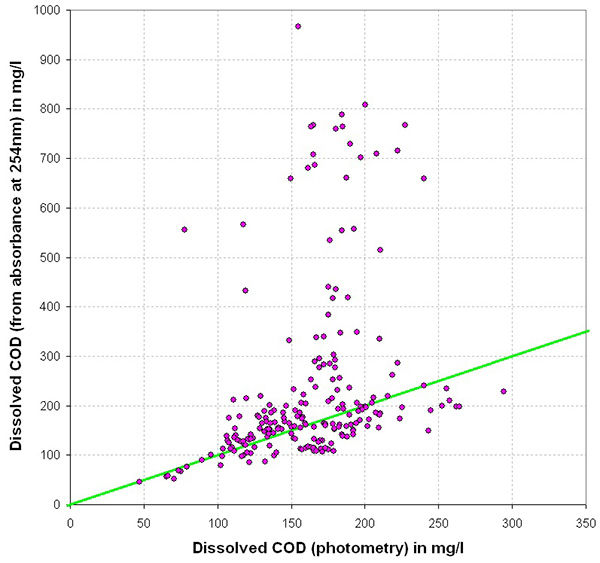
Figure 7. Correlation between COD measured using a photometric laboratory method and SAC 254 (UVT-254) (Franke, 2010)
Some of the potential causes of error include:
- Variability in the relative proportion of the various organic substances which make up the aggregate measurement of BOD, COD, or TOC.
- Lack of compensation for turbidity and inorganic substances such as chloride.
Spectral estimate of sum parameters is an alternative to single-wavelength measurements like SAC that can account for variability in wastewater samples. A spectral estimate provides greater precision by scanning multiple wavelengths across the spectrum to identify the signal from the various components that contribute to each sum parameter. The absorbance measurements acquired from each scan are used as inputs to an algorithm. The resulting calculation is valid for all samples of the same type, for instance, municipal wastewater.
Therefore, the algorithm is a basis for creating a calibration that can be loaded onto the sensor at the factory. Assuming the spectral fingerprint of the sample is a reasonable match to the fingerprint defined by the factory calibration, good performance can be achieved as demonstrated by Figure 8. In cases where the calibration and sample spectral fingerprints are not reasonably matched, an optional user calibration may be required. It is important to recognize that each application requires a different algorithm, e.g. municipal wastewater, drinking water, freshwater, and industrial wastewater. Furthermore, an estimate is not possible at all if the dominant organic molecules in the sample do not absorb in the range of the scanned wavelengths.
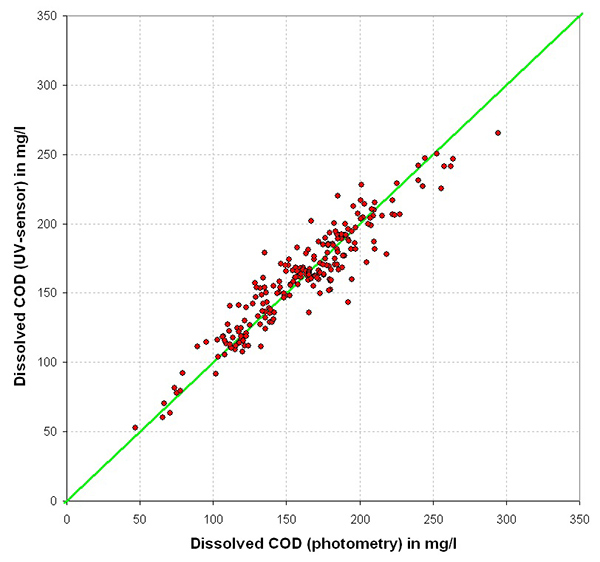
Figure 8. Correlation between COD measured using a photometric laboratory method and COD measured directly by UV-Vis spectrophotometry (Franke, 2010)
Nitrogen Parameters
Nitrate (NO3⁻) can be detected directly in the UV range and the concentration calculated according to Lambert-Beer. Single-wavelength detection of nitrate is achieved at a wavelength in the vicinity of the peak absorption where the signal from nitrate is dominant. The exact wavelength used varies with the instrument but is generally around 220 nm. Nitrite will interfere with the determination of nitrate according to a single-wavelength measurement because both substances show very similar and strongly overlapping absorbance spectra. The reason is clearly demonstrated in Figure 5. No single wavelength exists where nitrate and nitrite spectra are separated far enough from each other to enable direct determination of one without interference from the other. A single-wavelength sensor optimized for nitrate will capture only a fraction of nitrite in the sample resulting in an underestimate of NOx in samples with significant nitrite. Therefore, the user must exercise caution in the use of single-wavelength nitrate when nitrite is also significant. In addition to nitrite, there are also interferences due to organic matter.
Here again, the solution to provide a more precise measurement of nitrate is to scan multiple wavelengths utilizing spectral sensors. Furthermore, in order to differentiate and report nitrate and nitrite individually, a wavelength interval less than 1 nm is desirable. The algorithms to calculate nitrogen parameters are less complicated than what is required to calculate carbon sum parameters - nitrate and nitrite have the same spectrum regardless of the sample type. That being said, the best performance will be achieved when the calibration spectrum and sample spectrum fingerprints are reasonably matched.
Color Parameters
Color is another parameter that can be detected with UV-Vis spectrophotometric sensors. Color in wastewater is primarily caused by dissolved organic and inorganic substances that absorb light in the visible wavelength range, typically between 340 nm and 465 nm. These substances can originate from natural organic matter, industrial discharges, or treatment chemicals such as iron salts used for phosphorus removal. In municipal wastewater, changes in color can indicate variations in influent water quality from industrial discharges, fluctuations in organic content, the presence of residual chemicals, or incomplete treatment performance.
Unlike turbidity, which results from light scattering by suspended particles, color arises from true light absorption by dissolved materials. Measuring color therefore provides insight into the dissolved fraction of wastewater that is not captured by turbidity or solids monitoring. Consistent color measurements at the plant effluent can reflect stable process performance and the effectiveness of chemical treatment.
The YSI ColorVis sensor quantifies color using the Hazen (Platinum-Cobalt, Pt-Co) scale, the standard unit for measuring true color in water. The Hazen scale corresponds to visible light absorption between 340 and 465 nm, where most dissolved color-causing substances absorb most strongly. ColorVis can be configured to report up to three color parameters simultaneously, with the ability to report true color (turbidity-compensated) or apparent color (without turbidity compensation). Lower wavelength ranges (Hazen 340-390) are suited for treated effluent and higher ranges (Hazen 445-465) for darker influent or industrial wastewater. Learn more about the applications of the ColorVis sensor in Color as a water quality indicator.
Continuous color monitoring provides a reagent-free ability to deliver immediate feedback on treatment efficiency and to detect process changes related to organic load or ferric dosing. Integrating color alongside carbon and nitrogen parameters gives operators a more complete picture of water quality and process stability within the treatment plant.
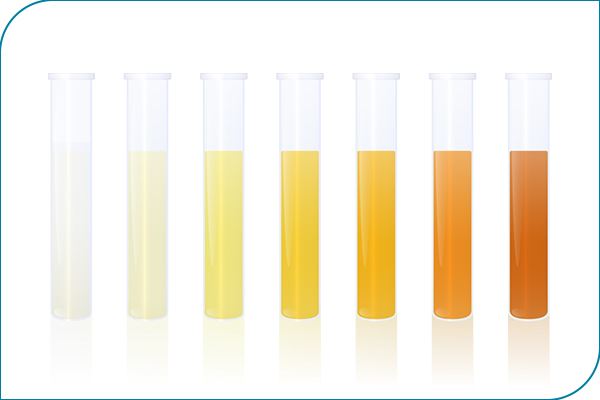
Figure 9: Glass tubes display a progression from clear to orange-tinted water, illustrating color variations measured by the Hazen scale.
Design of UV-Vis Spectrophotometric Probes
Table 1 summarizes the various types of IQ SensorNet UV-Vis and UV spectrophotometric sensors. The SAC (UVT-254) and NOx sensors are single wavelength general purpose sensors. The CarboVis®, NitraVis®, and NiCaVis® are multiple wavelength spectral sensors for municipal wastewater applications. The TS versions will also report total suspended solids (TSS). The NI versions report nitrate and nitrite. There are 2 measuring gap options: 1 mm and 5 mm. The 1 mm gap is for monitoring untreated wastewater and mixed liquor suspended solids (MLSS). The 5 mm gap is for monitoring treated effluent wastewater with low turbidity. (Learn more, IQ SensorNet UV and UV-Vis Sensor Selection Guide).
| Sensor Type |
Gap Widths (mm) |
Total Parameters |
Carbon Sum Parameters |
Nitrate |
TSS |
SAC, UVT |
NOx |
Color |
| CarboVis |
1, 5 |
5 |
x |
|
|
|
|
|
| CarboVis TS |
1, 5 |
5 |
x |
|
x |
|
|
|
| CarboVis TS Co |
1, 5 |
5 |
x |
|
x |
|
|
x |
| NitraVis |
1, 5 |
5 |
|
x |
|
|
|
|
| NitraVis TS |
1, 5 |
5 |
|
x |
x |
|
|
|
| NitraVis NI |
1, 5 |
5 |
|
x |
x |
x |
|
|
| NiCaVis |
1, 5 |
5 |
x |
x |
|
|
|
|
| NiCaVis TS |
5 |
5 |
x |
x |
x |
|
|
|
| NiCaVis TS Co |
5 |
5 |
x |
x |
x |
|
|
x |
| NiCaVis NI |
1, 5 |
5 |
x |
x |
|
x |
|
|
| ColorVis |
5 |
3 |
|
|
|
|
|
x |
| Single-Wavelength Sensors |
|
| SAC |
1, 5 |
1 |
|
|
|
|
|
|
| NOx |
1, 5 |
1 |
|
|
|
|
x |
|
Table 1. IQ SensorNet UV-Vis spectrophotometer sensor types
A UV-Vis spectrophotometric probe is shown in Figure 9. The probe consists of an enclosure, internal optical components, and electronic components where the firmware resides. The enclosure consists of an immersible cylindrical body that protects the internal optical components. The IQ SensorNet UV-Vis probe consists of a 60 mm diameter body made from titanium for maximum durability. The probe bodies of the other major brands are made from stainless steel. Lenses are located on each side of a measuring gap that is cut into one side of the probe. The measuring gap is flooded with sample when the probes are immersed in wastewater. Alternatively, a flow cell fits over the probe around the measuring gap. The IQ SensorNet UV-Vis probe lenses are made from sapphire, a material with durability and optical properties superior to quartz glass which is used by most other brands. An automatic cleaning system is essential to resist fouling of the outside of the lenses which would quickly interfere with the sensors causing unacceptable errors. The IQ SensorNet UV-Vis probes include UltraClean™, a built-in ultrasonic cleaning system. Other brands utilize wipers that require factory maintenance or require an additional air-cleaning system.
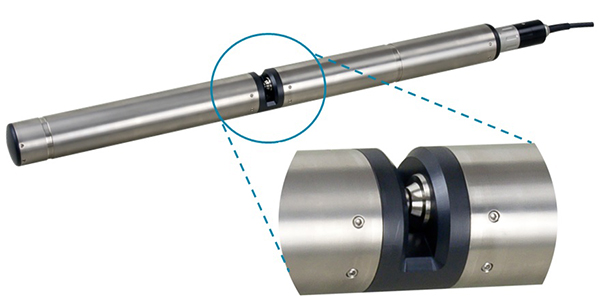
Figure 10. UV-Vis spectrophotometer probe
The major optical component of a UV-Vis sensor is a spectrophotometer to acquire the raw absorbance measurements. A diagram of the optical components of the IQ SensorNet UV-Vis sensors is shown in Figure 10.
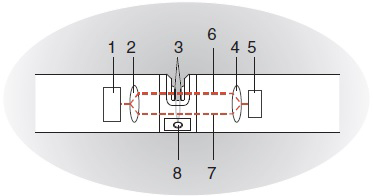
Figure 11. Diagram of the optical components of a UV-Vis spectrophotometer sensor.
The light source is a Xenon strobe lamp (1) which emits light over a range of wavelengths from ultraviolet to visible. The Xenon lamp has an exceptionally long lifetime. The sender of the optical system (2) splits the lamp output directing the measuring beam (6), through the sapphire lenses and the sample in the measuring gap (3). A second light beam, the reference beam (8), is directed over a distance without sample inside the probe body. The split beam design is typical for the most common brands.
However, the optical components of the measuring channel and the reference channel are identical in the IQ SensorNet providing automatic drift compensation and long-term stability. Other brands' reference and measuring channels are not identical. The receiver of the optical system (4) directs the measuring beam and reference beam to the detector (5) which consists of one or more fixed photodiodes. The single-wavelength configuration measures absorbance at a single wavelength in the UV range. The absorbance from a second wavelength at around 550 nm in the visible range is used to compensate for turbidity. This is how the IQ SensorNet SAC (UVT-254) and NOx sensors are designed. The detector for the IQ SensorNet UV-Vis spectral sensors is a multi-diode array that simultaneously measures light intensity for 256 equally-spaced wavelengths from 200 to 720 nm or from 200 to 390 nm (NI sensor). The benefit of scanning multiple wavelengths is discussed previously.
An accessory compressed air cleaning system (7) is provided to keep measuring windows clean. The air cleaning system is the only option for most brands. It is an optional, secondary system for IQ SensorNet UV-Vis sensors.
Each sensor is programmed with special algorithms that convert the raw absorbance signal(s) into a concentration measurement. The programming allows each probe to function as a factory-calibrated, precise, multi-parameter monitoring device. The firmware containing the algorithm that translates the measured absorbance values into a concentration value varies according to the type of sensor. The data to build the algorithms are obtained by recording spectra data from a significant number of wastewater samples collected throughout the facility and matching them to reference measurements of the desired wastewater parameters. Advanced multivariable mathematical techniques like principal component regression (PCR) or partial least squares (PLS) (Martens, 1989; Otto, 2007) are utilized to map the spectral data to the reference measurements. The end result is a calibration that is loaded onto the sensor via the firmware.
The calibrated measuring modes that are built into the IQ SensorNet spectral sensors are total COD, dissolved COD, nitrate, and nitrite. Furthermore, each spectral measuring mode is calibrated for up to three measuring locations:
- Inlet is for monitoring raw or primary effluent municipal wastewater upstream from activated sludge treatment.
- Outlet is for monitoring secondary or tertiary effluent municipal wastewater downstream from activated sludge treatment.
- Activation is for monitoring mixed liquor in anoxic and oxic zones of activated sludge treatment.
Not surprisingly, BOD, TOC, and DOC are often correlated with COD for a particular application. As discussed at the beginning of this paper, they are essentially different techniques for measuring organic carbon. These correlated parameters can also be monitored by the IQ SensorNet with a user calibration. The default factory calibration for these parameters is the corresponding COD parameter. Each spectral sensor can report up to 5 parameters including up to 3 carbon parameters, up to 2 nitrogen parameters, and TSS (TSS probe versions only).
The SAC (UVT-254) single-wavelength sensor reports up to 2 parameters. The default parameter for the SAC sensor is UVT-254. Also, a user-calibrated carbon parameter, e.g. COD or BOD, can be displayed.
The NOx single-wavelength sensor reports 1 parameter, NO3 or NO3-N. The calibrated default measurement for the NOx sensor is NO3-N.
Operation and Maintenance
The measuring cycle for the IQ SensorNet UV-Vis sensors depicted in Figure 11 consists of 3 automatic steps:
- Cleaning – IQ SensorNet UltraCleanTM, and optional air cleaning, is activated.
- Adjustment – a short time is provided after deactivation of the cleaning step and before the measurement step commences.
- Measurement – absorbance measurements are acquired and processed into concentration values.
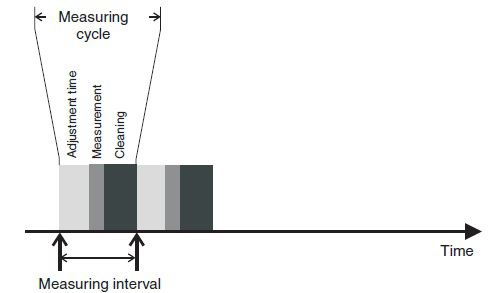
Figure 12. UV-Vis spectrophotometer sensor measuring cycle.
The measuring cycle is approximately 1 minute, depending on the duration of the user-adjustable cleaning step. The displayed measurement will be updated each cycle. The measurement step occurs in seconds, providing a nearly instantaneous update of each parameter every measuring cycle, which may result in a noisy measurement, especially in non-homogeneous sample matrices. Therefore, an optional user-adjustable signal smoothing setting is provided to buffer the signal. (learn more, IQ SensorNet Support Video Library).
Calibration
UV-Vis spectrophotometric sensors are calibrated at the factory. Alternatively, an optional user calibration may be entered to improve measurement reliability for sample matrices that are different from the default calibration matrix or to add or substitute correlated carbon parameters. A 1- or 2-point value pair calibration is possible for the IQ SensorNet. The data to create user calibrations is obtained from paired values of the reference measurements made on grab samples and the raw value displayed by the monitoring system at the time of the grab sample. The raw value is denoted by a # symbol in the display shown on the IQ SensorNet 2020. Proper and careful sample collection, handling, and preparation is critical for obtaining quality reference measurements.
Cleaning
Automatic and manual cleaning of the measurement lenses ensures optimal performance of UV-Vis sensors. UltraClean™  automatic ultrasonic cleaning will maintain IQ SensorNet UV-Vis lenses sufficiently clean for one week to one month without manual cleaning under typical conditions. Manual cleaning involves flushing out the measuring gap with clean water, applying cleaning solutions and wiping the lenses.
Replacement
The requirement for the replacement of worn items varies among brands. Some brands require factory maintenance every 1 to 2 years to replace cleaning or optical system components. The IQ SensorNet UV-Vis sensors will provide years of reliable operation without wear items or consumables aside from cleaning supplies.
Applications for Monitoring Carbon and Nitrogen
Parameters process control of wastewater treatment requires monitoring inputs and outputs of critical parameters such as BOD, TSS, and nitrate. Typical daily variations as well as short-term spikes can have a large impact on the operation of biological processes. Transient heavy loads can impact the treatment system resulting in many undesirable effects including high BOD in treated effluent, loss of nitrification, reduced sludge settleability, and overload of sludge handling processes. Therefore, a common application for UV-Vis spectral sensors is to monitor wastewater COD at the headworks or even further upstream in the collection system in order to provide an early warning for heavy loads or even to help track down the source. This may be particularly useful for small facilities which are more vulnerable to upsets from transient loadings than larger facilities on account of short sewer retention times and less dilution from other sources.
Monitoring of nitrate in biological nutrient removal (BNR) facilities is another common application for UV-Vis spectral sensors. Nitrate is the endpoint of the nitrification reaction and it is depleted during the denitrification process. Therefore, online monitoring of nitrate provides several opportunities for process optimization of nitrogen removal:
- Monitoring nitrate in oxic zones ensures efficient completion of nitrification, an essential first step of nitrogen removal.
- Monitoring nitrate in anoxic zones is essential for controlling input of expensive external carbon sources.
- Monitoring nitrate in secondary effluent ensures compliance with nitrogen limits.
Nitrite, if it is measured at all, is typically lumped together with nitrate as in the aggregate parameter NOx. However, measurement of nitrate only or NOx conceals important conditions. For nitrification, under certain conditions of temperature and dissolved oxygen (DO), the rate of ammonia oxidation exceeds the rate of nitrite oxidation.
The process control options that operators have if nitrite starts to increase include:
- Decreasing wasting, temporarily “holding” more solids for a higher SRT.
- Increasing the aeration rate.
- Activating oxic swing zones.
For denitrification, insufficient carbon or biomass can limit the reduction of nitrite to nitrogen gas causing nitrite accumulation. Limiting nitrification upstream to the extent that the process can fully denitrify and/or increase the external carbon dosing rate are options for process control. On the other hand, it is actually desirable to limit nitrite oxidation to reduce oxygen and carbon requirements for processes that denitrify through the nitrite shunt. In this case, some nitrite is essential. However, higher nitrite concentrations are detrimental to the process. Continuous monitoring helps operators to avoid conditions that upset the process.
Summary
Activated sludge is a biological process in which dissolved and particulate pollutants are removed by transforming organic carbon as BOD or COD into carbon dioxide (CO₂) and, if modifications for nitrogen removal are employed, ammonia nitrogen into nitrogen gas (N₂) through the intermediate compounds nitrite and nitrate. Therefore, monitoring COD and nitrate in the process is critical for process control. Carbon parameters, including COD, nitrate, and nitrite can be detected quickly and directly without the use of reagents by measuring the penetration of ultraviolet (UV) light through a sample using the principle of UV spectrophotometry. UV Vis spectrophotometric sensors built into probes that are immersed directly in the wastewater provide a continuous and direct online measurement of carbon parameters, nitrate, and nitrite without the need for costly reagents. Furthermore, the sensors have built-in factory calibrations which are very stable so user calibration is not required. Cleaning of the optical lenses is the only routine maintenance activity required. This is minimized with YSI IQ SensorNet due to unique built-in ultrasonic cleaning. Some brands also require factory service every 1 to 2 years to replace wear items. The IQ SensorNet UV Vis sensors do not have replaceable parts and never require factory service.


References
Franke, U, Honold, F. (2010) UV-Spectral Probe for Measuring Chemical Oxygen Demand, Nitrate and Nitrite in Wastewater. Proceedings WEFTEC 2010.
Martens, H., Noes, T. (1989) Multivariate calibration, John Wiley & Sons, ISBN: 0-471-90979-3Otto, M. (2007) Chemometrics, Wiley VCH Verlag, ISBN: 978-3-527-31418-8
Pons, M.; Wu, J.; Potier, O. (2005) Chemometric Estimation of Wastewater Composition for the On-Online Control of Treatment Plants, 16th IFAC World Congress, Prague.