Best Practices for Wastewater Process Monitoring of Ammonium and Nitrate with ISE Sensors
Nitrogen monitoring is critical for process control of wastewater treatment. Ammonia and nitrate can be monitored directly with water quality instrumentation based on ion selective electrode (ISE) technology. The objective of this post is to explain ISE technology for process monitoring of wastewater treatment and provide guidance on the proper selection, commissioning, maintenance, and operation of AmmoLyt, NitraLyt, and VARiON sensors that are part of the IQ SensorNet process monitoring system. The principles discussed are also applicable to competitors’ sensors, in general, although the design and operation of the sensors are specific to each brand.
Why is Ammonia and Nitrate Monitoring so Critical?
Carbon, nitrogen, and phosphorus are the building blocks of life and components of municipal wastewater. Wastewater treatment transforms or removes these components to prevent over-enrichment of receiving waters and undesirable effects. Ammonia, nitrite, nitrate, and organic nitrogen are forms of nitrogen in wastewater and are a prime consideration for the design and operation of water resource recovery facilities (WRRF).
For instance, ammonia is acutely toxic to aquatic organisms, so discharge permits nationwide include requirements to limit the concentration in treated wastewater. Requirements to limit total nitrogen (TN), including nitrate, address a chronic issue of nutrient over-enrichment, which can lead to harmful algae blooms. Laboratory measurement of grab or composite samples is the dominant method of compliance monitoring. However, process monitoring is increasingly being done with measurements from online analytical instrumentation. Continuous monitoring improves decision-making and reduces the burden on staff for sampling and measuring process parameters multiple times per day. The ISE is a simple, affordable technology for monitoring ammonia and nitrate without the need to replenish costly reagents multiple times per year.
Figure 1. Nitrification and Denitrification Pathway
Nearly all WRRF must deal with the effects of the various forms of nitrogen on process control. Besides toxicity, ammonia also has a significant oxygen demand from bacteria which convert it to nitrate, a process known as nitrification. Each pound of ammonia converted to nitrate consumes 4.6 lbs. of oxygen, but it is a mistake to include only raw wastewater ammonia-nitrogen in the calculation of nitrogenous oxygen demand (NOD) for aeration design or feed-forward control. Untreated wastewater also contains organic nitrogen, which is converted to ammonia upstream from aeration tanks. Therefore, NOD should be based on wastewater Total Kjeldahl Nitrogen (TKN), an analytical method that sums the organic and ammonia nitrogen or primary effluent ammonia if the facility includes primary treatment. Monitoring ammonia or nitrate downstream can be used for feedback control of aeration.
Nitrite and nitrate, collectively termed (NOx) are converted to nitrogen gas and removed from wastewater by another biological reaction known as denitrification. The denitrification reaction requires very low dissolved oxygen (DO) and a sufficient supply of dissolved organic carbon (DOC). Facilities may be designed for this reaction to occur by incorporating unaerated anoxic zones into activated sludge flow sheets. Nitrate and DOC monitoring are critical for denitrification process control. Denitrification may also be an unintended consequence of deep sludge blankets in secondary clarifiers. The nitrogen bubbles produced can float solids that escape over the weir, increasing total suspended solids (TSS) and BOD in treated effluent and possibly causing a discharge permit violation.
Sensor Design and Principle of Operation
Analysis with an ISE is based on potentiometry, a common analytical technique that has been utilized for decades for monitoring pH and oxidation reduction potential (ORP) in wastewater samples. ISE measuring systems consist of 2 electrodes, an ion selective electrode and a reference electrode connected across a voltmeter, as shown in Figure 2.
Figure 2. Diagram of an ion selective measuring system showing the ISE, reference electrode, and voltmeter.
Each electrode consists of a wire immersed in an electrolyte. The ion selective electrode, shown in Figure 3, is separated from the sample by a membrane. The membrane is designed to interact with a specific analyte of interest, e.g. ammonium or nitrate. ISE potential (mV) is affected by changes in the effective concentration of the analyte. The reference electrode, shown in Figure 4, is separated from the sample by a junction. The junction is designed to provide electrical continuity with the sample. Reference electrode potential is designed to remain stable over a range of sample conditions so that changes in the potential of the ISE are proportional to changes in the ammonium or nitrate concentration. One reference electrode can be coupled with multiple ISEs.
Figures 3 and 4. Diagram and sample model of an ion selective electrode. Membrane design is part of the reason for the superior performance of YSI ammonium and nitrate ISE sensors.
The ISE probe measures the difference in electrical potential which develops between the ISE and the reference electrode depending on the composition of the sample with a voltmeter which provides a raw signal, U, in milliVolts (mV). The mV signal is related to the concentration of the parameter of interest by the Nernst equation:
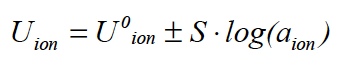
A few important features of this equation are:
1) The equation describes a straight line with an offset of U0 ion and a slope of S. The theoretical value of the slope (S) is 59.2 mV at 25°C for ammonium, nitrate, and other ionic substances with a charge of +/- 1.
2) The relationship between concentration and signal is logarithmic. A change in signal of 59.2 mV corresponds to a tenfold change in concentration.
3) The Nernst equation regards the effective concentration or activity of ions.
Figure 5 demonstrates another important fact that is not obvious from the equation. That is, an ideal linear relationship is not maintained at low concentrations. The actual curve in the concentration range below 1 mg/L is not linear. In this range, the electrode has a weaker response. In YSI measuring systems, nonlinearity is taken into account automatically.
Tip: Reliable sensor performance at low concentrations is especially sensitive to good sampling and analysis practices on reference measurements. Customers with proper training and good sampling and analytical skills are successful in reliably monitoring concentrations as low as 0.5 mg N/L or lower. Novice users should not attempt matrix adjustments unless actual ammonium or nitrate concentrations are greater than 1.5 mg N/L.
Figure 5. Real response curve of a nitrate ISE (solid line) and ideal Nernst relationship (dashed line)
IQ SensorNet ISE Sensors
Four different types of sensors that are available as part of the YSI IQ SensorNet are based on ISE technology. The focus here is the nutrient sensors, the AmmoLyt (for ammonium), NitraLyt (for nitrate), and VARiON (for ammonium and nitrate). The SensoLyt pH/ORP sensor is also based on ISE technology but will not be discussed in further detail.
Figure 6. VARiON electrode ports
The YSI nutrient ISE sensors consist of 40 mm stainless steel probes with 3 electrode ports (AmmoLyt, NitraLyt) or 4 electrode ports (VARiON). One port, marked with a dimple (see Figure 6), is special for the reference electrode. The remaining ports are not specific and will accept all other electrodes designed for the probe. Each sensor requires a reference electrode and at least 1 ammonium or nitrate ISE. The probe/electrode combinations available for the IQ SensorNet are shown in Table 1. All probes are compatible with System 2020 or System 282/284. Each ISE, including the compensation electrodes, will require 1 channel to display. Display of compensation parameters is optional.
| Sensor Model |
Item Number |
Reference Electrode |
Ion Selective Electrodes |
| VARiON Ref |
VARiON Plus NH4 |
VARiON Plus NO3 |
VARiON Plus K |
VARiON Plus Cl |
| AmmoLyt Plus 700 IQ Set |
107 071YK |
Included |
Included |
|
Not Included |
|
| AmmoLyt Plus 700 IQ Set/Comp |
107 072YK |
Included |
Included |
|
Included |
|
| NitraLyt Plus 700 IQ Set/Comp |
107 082YK |
Included |
|
Included |
|
Not Included |
| NitraLyt Plus 700 IQ Set/Comp |
107 082YK |
Included |
|
Included |
|
Included |
| VARiON Plus AN/A Set |
107 066YK |
Included |
Included |
Included |
Included |
Not Included |
| VARiON Plus A Comp Set |
107 060YK |
Included |
Included |
Not Included |
Included |
Not Included |
| VARiON Plus AN/N Set |
107 068YK |
Included |
Included |
Included |
Not Included |
Included |
| VARiON Plus N Comp/Set |
107 062YK |
Included |
Not Included |
Included |
Not Included |
Included |
Table 1. IQ SensorNet Nutrient ISE Sensor Types
Tip: Select compensation electrodes based on the anticipated concentrations of ammonium and nitrate. Dynamic compensation is most important at ammonium and nitrate concentrations less than 10 mg N/L. Dynamic compensation may not be required in typical municipal wastewater applications at concentrations greater than 10 mg N/L. For a VARiON, if both ammonium and nitrate are anticipated to be consistently below 10 mg N/L, choose the compensation electrode based on which is expected to be at a lower concentration or which is most critical for your application. Cross compensate the other parameter from a second nutrient ISE if it is installed in the system. Otherwise, enter a static value from a suitable reference measurement.
Opening the Boxes
The probe and electrodes are packaged separately. The box containing the probe body includes the following items:
1. Probe body
2. Probe tool
3. Owner’s Manual
The probe body is shipped with protective boots on both ends and blind plugs in the electrode ports. The boots can be removed and saved for later storage of the probe or discarded. The plugs are identical in form to the ISEs except they are lacking a membrane. The plugs keep the ports dry during storage, which is very important for the functioning of the sensor. Moisture can damage the electrical connections and cause measurement interference. Save the blind plugs to safely store the sensor at a later date.
Tip: Prevent moisture from entering the electrode ports when replacing electrodes or removing them for storage. Carefully wipe the sensor face and electrodes dry with an absorbent cloth and hold the sensor with the electrodes and ports pointing down.
The probe tool is required for removing and installing plugs and electrodes. It is shaped to fit the electrodes and plugs which are threaded into the ports. Keep it in a convenient place. It will be required for commissioning and for replacing electrodes thereafter.
The electrodes are shipped in two types of boxes. The reference electrode is larger than the ISEs requiring a larger box. A bottle of reference electrode storage solution is also inside the box. The box the reference electrode ships in and its contents are shown in Figure 7. The electrode is shipped in a protective 2-piece cap containing storage solution. Do not remove the cap until immediately before deploying the sensor. The reference electrode and ISEs must not be allowed to dry out. Save the cap and the storage solution for later use.
The ion selective electrodes (NH4, NO3, K, Cl) are shipped in smaller boxes containing the electrode in a storage vial. A sponge soaked with standard solution is in the end of the vial cap which threads onto the translucent vial. The vial opening is also threaded on the inside to accept the threaded electrodes. The electrodes are removed from the vial using the electrode tool.
Figure 7. Typical pipette and tips used for colorimetric determination of ammonia, nitrate, potassium, and chloride.
Commissioning
1.) Install the electrodes on the sensor by removing the blind plugs and inserting the electrodes using the probe tool and attach the probe to the sensor cable.
2.) Lower the sample into the measurement location. The probes should be placed so that the electrodes are immersed a minimum depth of 5 inches at all times.
3.) Leave the sensor in the water for a minimum of 30 minutes up to overnight. The longer the better.
4.) Start a matrix adjustment by pressing ‘C’ on the controller and follow the instructions.
Tip: Select a measurement location where a representative sample of the process is obtained and with safe and convenient maintenance access. A swing mount on a chain is recommended so the sensor can move in the basin and some self-cleaning is provided. A swing mount is also easier to retrieve for cleaning and inspecting the electrodes.
The Matrix Adjustment Procedure
The unique potentiometric properties (matrix) of each application require adjustment of the offset, Uo ion, as part of the commissioning procedure. Subsequent matrix adjustments are required from time to time to account for changes in the sample matrix and aging of the sensor. The procedure is very simple because the sensor remains in the test sample. The monitoring system stores the relevant data while the current measured value for each parameter in the sample is being determined by a second, independent reference procedure. The advantage of this method is that all matrix effects are accounted for simultaneously.
Step 1 – Selecting electrodes
The first step is to select the electrodes to matrix adjust. At commissioning of the probe, all electrodes are required to be adjusted but thereafter the user can elect to not adjust all electrodes. For example, if all electrodes are not replaced at the same time. Also, it may not be necessary to adjust compensation electrodes as frequently as ammonium and nitrate.
Figure 8. Contents of box that reference electrode ships in. The white cap threads on to the VARiON Ref and should be re-filled with 3M KCl Fill Solution for storage and shipment.
Step 2 - Electrode zeroing
Electrode zeroing resets the drift voltage for each electrode. The drift voltage provides an evaluation of the long term behavior of an electrode in its application. The user sets the drift voltage to zero to start the evaluation period. For example, it is usually done during the initial commissioning or when inserting a new or different electrode. More details on interpreting drift voltage are provided below. (The change in the drift voltage over time indicates changes of the matrix or the electrode characteristics.)
Step 3 – Cleaning
Fouling of electrodes is removed by gently scrubbing them with a soft bristle brush. The membranes are protected by a stainless steel mesh to prevent physical damage. Detergents, solvents, or other cleaning agents will cause chemical damage to the membrane and must not be used. The best cleaning solution is process water because it has the same properties as the sample. In other words, the matrix is the same. The matrix of distilled water or even tap water is very different and can de-stabilize the membrane interfering with the matrix adjustment and long-term stability of the sensor.
Step 4 – Determination of reference voltage
The controller measures the reference voltages for each electrode and stores that information to match up with reference values (Step 7).
Step 5 – Sampling
Grab samples are collected using a sample dipper or other suitable device as close to the electrodes as possible. Rinse the sampling container by immersing it in the sample and emptying it a couple of times to remove residue from previous samples. Filter samples immediately through a 0.45 um filter to remove solids and stop biological activity which will alter the composition of the sample in a very short time. Ammonia and nitrate are dissolved and will pass through the filter. Disposable syringes and syringe filters with luerlock fittings and snap-cap sample vials are convenient for this purpose. The syringe can be reused on the sample but the syringe filter must be replaced as it becomes plugged with solids. Depending on the sample 3 or more filters may be required to accumulate the sample volume required for measurement. Collect at least 6 mL of filtered sample for each parameter being measured. The filtered samples are stable and ready for analysis to determine reference values at a convenient time. The matrix adjustment can be exited and the sensor taken out of maintenance mode in the interim. The controller will store the progress up to this point automatically and indefinitely. Pressing “C” on the controller allows the user to re-enter the matrix adjustment where it was left off.
Step 6 – Determination of reference values
Multiple measurement methods are available for determining reference values. Colorimetric methods using pre-made chemistries and a portable or benchtop photometer are convenient, simple, and reliable. A pipette and pipette tips similar to what is shown in Figure 8 will be necessary for adding sample to reagent vials. Triplicate measurements are recommended for each parameter for determining the most representative measurement. All 3 measurements can be set up simultaneously to save time. Write down the most representative reference measurement determined in Step 6 for each parameter.
Tip: It may be appropriate to average all triplicate measurements if the difference in values between all three measurements is similar. In other cases, the two closest measurements are averaged if the third measurement is very different. New measurements are recommended if the values of any two measurements are not relatively close.
Step 7 – Entering reference values and interpreting report
Reference values are manually entered into the controller and automatically matched with reference voltages determined in Step 4. If all values are successful, the user can store all values or selectively choose which values to store. Values that are outside the acceptable range, e.g. the drift voltage exceeds the allowable range, or which are not stored revert to their status prior to initiating the matrix adjustment.
Figure 9. Typical ISE calibration report
Interpretation of the Calibration Report
At the completion of each matrix adjustment, a calibration report is updated for each electrode adjusted (see Figure 9). A description of the meaning of each item in the calibration report is shown in Table 2. The initial matrix adjustment when the electrode was zeroed is displayed on the top row. Subsequent matrix adjustments are displayed below in chronological order. Drift voltage (DV) is a critical parameter indicating the status of the electrode. It is a calculation of the difference from the expected result based on the initial matrix adjustment. DV becomes more negative or more positive as electrodes age, the wastewater matrix changes, or as a result of errors in sampling, sample preparation, or analysis technique. If the absolute value of DV exceeds 45 mV, the procedure fails and a “?” will display in the ‘R’ column.
| Column |
What it Means |
Possible or Acceptable Values |
| DV |
Drift Voltage |
-45 mV to +45 mV |
| S |
Slope* |
+/- 59.2 mV |
| Ref1 |
Reference concentration measured with lab equipment |
0.1 to 1,000 mg N/L (2,000 mg N/L for ammonium) |
| Ref2 |
Not applicable to matrix adjustment |
| K+ or Cl- |
Measured or manually entered compensation parameter concentration |
0.1 to 1,000 mg/L |
| P |
Procedure |
1 = Matrix adjustment
3 = Calibration
|
| T |
Temperature |
-5oC to 60oC |
| R |
Result |
+ or ? |
Table 2. IQSN Nutrient Calibration Report Field Descriptions
Interpretation and Display of Ammonia and Nitrate Measurements
Ammonia exists in 2 forms in wastewater: ammonium ion (NH4 +) and free ammonia (NH3). The relative proportion of the 2 forms depends primarily on the pH of the sample and, in small part, the temperature of the sample as shown in Figure 10. Ammonia in wastewater samples that are near neutral (pH=7) is almost entirely in the NH4 + form. The AmmoLyt and VARiON sensors are designed to detect ammonium but not free ammonia. The relative proportions of free ammonia and ammonium for a particular pH and temperature is a well-known relationship. YSI can provide a worksheet calculator for your convenience.
Figure 10. The relationship between sample pH and the proportion of ammonia that exists as ammonium and free ammonia
Tip: Laboratory reference methods intentionally shift the pH of the sample to convert all of the ammonia to either the free or ionized form, providing a total ammonia nitrogen (TAN) concentration. If the sample pH is higher than 7.0, the ammonium proportion of the sample, which is the required reference measurement for verification and matrix adjustment, can be calculated from the laboratory result if the pH and temperature of the sample are known.
Figure 11. Effect of potassium on displayed measurement from ammonium ISE measuring system
The default measuring mode is NH4-N or NO3-N. This is the form typically used in wastewater treatment because it allows for convenient evaluation. For example, 1 mg/L of NH4-N/NH3-N is converted to 1 mg/L of NO3-N (there is no difference between NH3-N and NH4-N because only the ‘N’ is counted). Multiply NH3-N/NH4-N by 1.21 to obtain NH3 or 1.28 to obtain NH4. Likewise, multiply NO3-N by 4.4 to obtain NO3.
The ammonium ISE membrane is very selective. However, many substances interact with the membrane, causing interference. The most significant interference is potassium (K). The system will dynamically compensate for changes in potassium if a VARiON Plus K electrode is installed. A constant compensation factor is applied without a K electrode. Therefore, an error in the potassium measurement will cause an error in an otherwise perfectly functioning ammonium ISE. Figure 11 shows the error for a range of ammonium concentrations displayed by an AmmoLyt or VARiON sensor at various levels of Potassium. Likewise, the most significant interference for nitrate is chloride. Figure 12 (page 8) shows the error for a range of nitrate concentrations displayed by a NitraLyt or VARiON at various levels of chloride. Figures 11 and 12 demonstrate that the lower the concentration of ammonium or nitrate, the greater the relative impact of the potassium or chloride interference.
Tip: Be prepared to measure ammonium and potassium (AmmoLyt, VARiON) and nitrate and chloride (NitraLyt, VARiON) as part of the matrix adjustment during commissioning. Do not use default values. Many WRRF do not measure potassium or chloride routinely and have no resources to do so on site. A portable photometer, e.g. YSI pHotoFlex, is a fast, reliable, and convenient method for obtaining all four measurements (two for an AmmoLyt or NitraLyt).
Special Procedures
Sensor Check
The functioning of electrodes can be objectively evaluated using the Sensor Check procedure if measured values do not seem plausible. The procedure requires the probe to be removed from the sample and placed into two standard solutions, a high standard (ES-2) and a low standard (ES-1), in order. The system automatically evaluates the sensor by measuring the potential for each electrode in each standard and calculates a slope. At the end of the check, the results for each electrode is shown on the display with “+” (successful) or “-” (unsuccessful) if it evaluates outside the valid ranges in Table 3. Each electrode that evaluates unsuccessful should be replaced as soon as possible.
Calibration
The calibration procedure is the same as the Sensor Check except that a new slope is calculated and saved in the system altering the response of the sensor. A calibration should never be attempted because of the very strict requirements for temperature and hygiene. However, in the event of an errant calibration, the factory slope can be restored by zeroing the electrodes at matrix adjustment.
Figure 12. Effect of chloride on displayed measurement from nitrate ISE measuring system
|
Valid Ranges (mV) |
| Electrode |
ES-2 |
ES-1 |
Slope |
| NH4 |
97.0 - 137.0 |
37.0 - 77.0 |
50.0 - 70.0 |
| NO3 |
147.0 - 187.0 |
202.0 - 242.0 |
| K |
79.0 - 119.0 |
21.0 - 61.0 |
| Cl |
128.0 - 168.0 |
184.0 - 224.0 |
Table 3. IQSN Nutrient ISE Sensor Check Valid Ranges