Turbidity Units, TSS, Water Clarity, Suspended Particles Measurement, Turbidity in Water

turbidity in water measurement and monitoring

What Is Turbidity?

Simply put, turbidity is the measurement of water clarity (i.e., transparency). Suspended particles – such as silt, algae, plankton, and sewage – can cause water to appear cloudy or murky. These particles scatter and absorb light rays rather than allowing light to be transmitted straight through the water.1

A higher turbidity reading represents cloudier and ‘thicker’ water with more particles throughout. When water is clear, it has low turbidity levels.

turbid water
Glacial meltwater is typically colder, has lower salinity, and has higher turbidity than ocean water.2 In this image, turbid meltwater (right) meets ocean water off the coast of Greenland.

What Units Are Used for Turbidity?

Turbidity measurements are most commonly presented in Nephelometric Turbidity Units (NTU) or Formazin Nephelometric Units (FNU). While they are often used interchangeably, these units for turbidity are different – they represent the turbidity measurement method used.

NTU represents turbidity readings captured using a white light at a 90-degree detection angle. Sensors that use this type of measurement method are compliant with EPA Method 180.1.1

In contrast, FNU is the correct unit when using an 860 nm light (near IR) with a 90-degree detection angle. Sensors using this method are typically compliant with ISO7027.1

Check out the Light Source and the Angle of the Detector(s) sections to learn more!

We also encourage you to check out our technical note on Turbidity Units and Calibration Solutions, and our blog post on Turbidity Measurements: Tips and Precautions.

What Are Sources of Turbidity?

There are several ways particulates can get into a natural body of water, causing an increase in turbidity. The first is storm runoff.

As rain and melting snow flow across the landscape, particulate matter is picked up. This may be pollutants, dust, pet waste, and more in an urban environment. In a rural setting, this may be loose soil or leaves. As rainfall enters a water body, the velocity will increase, eroding riverbanks and causing additional sediment influx.

turbidity monitoring stormwater runoff
Storm runoff is a common source of turbidity as rainwater collects sediment like dirt and debris.

Spikes in turbidity can be tied to a number of different sources, many of which are listed below:

Wind erosion is a less common source of turbidity. Dust devils, tornadoes, and heavy wind can displace soil from the top of the ground and then suspend it in the air. The sediment will eventually drop out of the air and fall to the ground, potentially landing in a water body.

Coastal erosion is another source of turbidity. Waves naturally stir up sand from the bottom of the ocean and deposit it on the beach, but they also take sand from the beach back out to sea.

turbidity monitoring
Powerful storms can severely erode beaches, resulting in increased turbidity in the ocean until the sand redeposits itself.

As land is cleared for building, rain events can cause loose sediment from construction sites to wash away. Silt fences are used to contain this runoff, but they aren’t always 100% effective, especially during significant storm events.

turbidity monitoring water quality
An example of a silt fence used to contain runoff and prevent loose dirt from ending up in bodies of water.

Dredging is digging sediment out of a channel to increase its depth. As shipping vessels grow in size, channels must get deeper. Dredging vessels must be deployed to fight natural channel sedimentation and ensure safe passage for barges. When dredging of a channel occurs, turbidity typically increases. If you’re really digging this topic, check out our blog on Real-Time Water Quality Data Used to Protect Ecosystem During Dredging.

Sewer discharge into waterways can occur during large storm events when combined sewer systems – sewers that collect rainwater runoff and wastewater – become overwhelmed, resulting in a direct release of sewage into water bodies. Combined sewer overflow (CSO) events often cause a spike in turbidity.

Animals can contribute to turbidity when their activities stir up silt, cause erosion, or release solid waste into the water.

Algae in water can be another source of turbidity, as the growth of these organisms prevents sunlight penetration into the water column. Not only does this increase turbidity, but it can also negatively impact predators that rely on sunlight to pursue their prey.3

turbidity water monitoring algae
Turbidity can also be due to algae in the water, not just dirt and debris. This image shows an algal bloom in the Baltic Sea.

Turbidity vs. Total Suspended Solids (TSS)

We can’t talk about turbidity without mentioning total suspended solids (TSS). Both are impacted by particles suspended in water, but they are fundamentally different measurements.

Turbidity is specifically looking at the clarity of the water. This is often quantified by determining the amount of light scattered by particles suspended in water. Size, shape, composition, and surface characteristics determine how a particle will scatter light. But the principle behind turbidity measurements is that, on average, increases in turbidity indicate an increase in suspended particles per unit volume of water.

Many turbidity sensors operate by shining a light beam into the sample solution and measuring the light scattered off particles – see How is Turbidity Measured? Typical units used for turbidity include FNU and NTU – see What Units Are Used for Turbidity? to learn more.

In contrast, TSS sensors quantify the concentration of suspended particles; the units used are milligrams per liter (mg/L). TSS is preferred over turbidity in applications such as wastewater, where it is critical to understand the amount of biological activity in the treatment system (i.e., the biomass). See the section Why Measure Turbidity in Wastewater? for more about this application.

It is possible to indirectly measure TSS with a turbidity sensor. Instruments like the YSI ProDSS can calculate TSS from a turbidity measurement if correlation coefficients are determined.

To establish a correlation between turbidity and TSS, turbidity data and corresponding samples must be collected at a sampling site. The samples need to be analyzed in a lab to determine a true TSS measurement (mg/L). Coefficients can then be calculated using the pairs of turbidity and TSS data. For the ProDSS, this is done with YSI’s Kor Software.

It’s important to note that correlation data must be collected for each unique sampling site, as this correlation is site-specific.

Learn more about turbidity, TSS, and a related parameter – total dissolved solids (TDS) – in our blog on Understanding Turbidity, TDS, and TSS.

Turbidity vs. Color

While the color of water can affect a turbidity measurement – colored particles can absorb the light bean used in some measurement technologies1turbidity is not a measure of water color.

Water can appear colored due to dissolved compounds or suspended particles. For example, tannins are dissolved organic acids that can give water a tea color. These leach into water when plant material – such as pine needles and tree roots – are slowly broken down into small particles that dissolve in water.4

turbidity measurement color of water
Turbidity is not a measure of the color of water. Rivers with high color saturation or that appear dark may not have sediment or high turbidity levels.

Why Measure Turbidity in Water?

Along with temperature, dissolved oxygen (DO), pH, ORP, and conductivity, turbidity is one of the most commonly measured water quality parameters. However, turbidity is important for different reasons in different applications – from impacting fish trying to find their spawning areas to the taste of beverages. Keep reading to learn more!

Why Measure Turbidity in Surface Water?

Turbidity is an excellent indicator of ecosystem health. While low dissolved oxygen (DO) levels are often due to eutrophication, high turbidity levels can also cause hypoxic conditions to develop because:

  • Excess particles in the water displace oxygen.
  • These particles can also absorb heat, causing an increase in water temperature and a subsequent decrease in dissolved oxygen.5
  • Additionally, high turbidity reduces the penetration of sunlight, slowing photosynthesis. A byproduct of photosynthesis is gaseous, molecular oxygen that can become dissolved in water.5

Turbidity-increasing particles can also clog up fish gills, and when combined with low DO, fish kills can result.

In extremely turbid conditions, animals may not find each other – or their paths to spawning areas – leading to lower reproduction rates. If a heavy sediment load is introduced into typically clean water where fish lay their eggs or where shellfish live, these organisms may not survive.

turbidity measurement in streams
Sockeye salmon (Oncorhynchus nerka) – also called red salmon – reach their spawning area in the Copper River in Alaska. High turbidity levels can make it difficult for fish to find spawning areas.

Monitoring turbidity upstream and downstream of a construction or dredging zone can help determine if there are likely to be any significant environmental impacts due to these activities. Depending on the project, this type of monitoring is sometimes required. As mentioned in the section on turbidity sources, loose sediment from construction sites can easily wash into waterways, causing a spike in turbidity levels.

In the U.S., states are required under section 303(d) of the Clean Water Act (CWA) to generate a list of impaired water bodies that contain pollutants at levels that exceed protective water quality standards. A Total Maximum Daily Load (TMDL) – the maximum amount of a pollutant that can be present and still meet water quality standards – is then established for the impaired waters.6

The pollutant(s) causing the water body to be impaired can originate from multiple sources. In this case, the state can allocate loading capacity among non-point sources (e.g., land runoff) and point sources (e.g., a discharge pipe coming from an industrial facility). The EPA’s National Pollutant Discharge Elimination System (NPDES) program issues point source permits.6

Turbidity is often used as a surrogate measurement of pollutant transport in a system – the assumption is that particles carry other pollutants of interest. Therefore, turbidity is a parameter of interest in listing impaired waters, developing TMDLs, and in NPDES permitting. Check out our blog on how turbidity monitoring helps keep Lake Oconee clean to see a real-world example!

In stormwater management – TMDLs apply to both stormwater and wastewater – one way to control pollutant concentrations and loads is through stormwater Best Management Practices (BMPs), such as retention ponds. Monitoring for turbidity is one way to determine how water quality has improved due to BMPs.

turbidity monitoring
Stormwater retention ponds are an example of a stormwater BMP. They are often constructed in developed areas to capture – and even filter – pollutants that wash off the landscape (e.g., street surfaces).7

Turbid waters can negatively impact the recreational use of waterways, as many people don’t like to swim, boat, or fish in water that appears “dirty.” As a result, some recreational areas monitor turbidity levels, as these data can provide insight into how the water’s appearance affects public use.

turbidity water level clear
Turbidity correlates with cleanliness – people prefer swimming in water with lower turbidity levels. Located along the California and Nevada border, Lake Tahoe is well known for its clear water.

Why Measure Turbidity in Drinking Water?

Turbidity is measured at nearly all drinking water treatment facilities. Not only does it provide a general indication of water quality – high levels are associated with disease-causing microorganisms – it also indicates the effectiveness of filters used in the treatment process.8

Drinking water treatment facilities typically get their water from one of three sources:

  1. Surface water, such as lakes or rivers.
  2. Groundwater under the direct influence of surface water. This is defined as groundwater with rapid shifts in water quality parameters that correlate with climatological or surface water conditions. Sources can also fit this description if there is a significant presence of macro-organisms, algae, or large-diameter pathogens.9
  3. Groundwater – water found in pores and crevices below the earth’s surface.

In the United States, facilities that treat surface water or drinking water under the direct influence of surface water are required to measure turbidity.8 Measurements must be taken at different locations in the facility, such as the combined filter effluent.

turbidity measurement drinking water
Dayton, Ohio’s wellfields are considered by the Ohio EPA as groundwater under the direct influence of surface water. Surface water from the Great Miami River (seen here) and the Mad River gets diverted into channels and retention basins where it percolates into an aquifer.10

Some municipalities may choose to measure turbidity at locations where they are not required so they can continuously monitor all stages of their treatment process. Consumers notice when turbidity levels in their drinking water spike, so water treatment staff do their best to prevent complaints.

If turbidity values are too high – facilities with conventional filtration cannot exceed 1 NTU8 – adjustments need to be made to the treatment processes and/or pump systems, which can be costly. According to the World Health Organization, at turbidities above 1 NTU, higher disinfection doses or contact times are required to ensure adequate treatment.11

turbidity monitoring drinking water
Turbidity indicates the effectiveness of filtration inside the treatment facility and can expose potential issues in the distribution system outside of the facility.

Turbidity is also important outside the walls of a drinking water treatment facility. In the distribution system, turbidity can indicate hydraulic upsets – such as a water main break – or the intrusion of contaminants due to pipe damage.12

Municipalities in the United States are typically required to collect samples from the distribution system and analyze them in a lab for turbidity. Some also choose to have online turbidity analyzers in the distribution system, as the real-time data collected can indicate issues in the system (e.g., a water main break); however, online monitoring is not required by law.

Why Measure Turbidity in Beverage Production?

Industrial facilities that use water to produce beverages often treat the water they receive from a well or the local municipality before using it in the production process.

Turbidity is an aesthetic concern in food and beverage production – consumers won’t drink a beverage with an unusual color or ‘cloudiness’ to it.

Turbidity can also indicate the presence of solids that precipitate out and cause issues with taste (e.g., calcium causes a bitter taste).

turbidity measurement
Turbidity is a parameter of interest in beverage production, as high turbidity levels in starting water can cause issues with color and taste in the final product.

Why Measure Turbidity in Wastewater?

TSS is typically the parameter of interest rather than turbidity in municipal wastewater treatment – see the section Turbidity vs. Total Suspended Solids for more information on the difference between these.

Microbes consume waste or transform it into less harmful end products in the treatment process. Activated sludge – a flocculated mass of these microorganisms – must be carefully managed. TSS plays a vital role in this management, as it estimates the amount of biological activity in the treatment system (i.e., the biomass).

turbidity monitoring tss wastewater
Monitoring parameters like TSS can help sustain the optimal biomass for activated sludge, leading to a stable and consistent wastewater treatment process.

To learn more about how TSS data from online instrumentation can be used for improved monitoring and control of activated sludge, check out our webinar on Process Control Strategies for Activated Sludge Optimization.

It’s important to note that treatment facilities in the United States are required to measure TSS to comply with their National Pollution Discharge Elimination System (NPDES) permit.

How is Turbidity Measured?

In general, measurement tools fit into three categories:

  1. Visual Tools require the user’s judgment to determine water clarity. Length units are used when reporting results (e.g., meters, feet).
  2. Turbidity Meters technically known as nephelometers – emit light and measure the amount scattered by particles in the sample. The units depend on the wavelength of the light and the angle of the detector(s)13; the most common units are Nephelometric Turbidity Units (NTU) or Formazin Nephelometric Units (FNU). Another term used for this type of instrument is a turbidimeter. These take the form of either a benchtop meter, continuous flow meter, or a submersible sensor (e.g., the YSI EXO or YSI ProDSS with a turbidity sensor).
  3. Spectrophotometers direct a beam of light at a specific wavelength through the sample. A detector determines the amount of light transmitted (i.e., the amount of light that doesn’t get scattered or absorbed). Depending on the light source, the units used are Attenuation Units (AU) or Formazin Attenuation Units (FAU).Since methods of turbidity measurement required by regulators require FNU or NTU, spectrophotometers are less common in the applications where turbidity is most commonly measured. Therefore, spectrophotometers are not discussed in more detail on this page.

Visual Tools

The Secchi Disk

The Secchi disk was invented by Pietro Angelo Secchi – an Italian Jesuit priest – in 1865 while serving as a scientific adviser to the Pope. He developed the disk that bears his name while quantifying water clarity in the Mediterranean Sea.14

turbidity measurement of water clarity
The world’s first measurement of water clarity with a standardized tool – the Secchi disk – was taken in the Mediterranean Sea on April 20, 1865. Pietro Angelo Secchi was conducting an aquatic study while serving as one of the Pope’s scientific advisers.

The original Secchi disk featured an all-white, weighted circular disk. George C. Whipple modified the disk in 1899 for freshwater by adding alternating quadrants of black and white, as he believed it was easier to see than the marine version.15

Today, the black and white Secchi disk seems to be the most commonly used version, although some marine researchers still prefer a white disk.

The Secchi disk is used by lowering it through the water column until it is barely visible. The measurement recorded is the distance – in meters, feet, etc. – the disk was lowered into the water.

The advantage of using the Secchi disk is that it is low cost, portable, and easy to use. The primary disadvantage is that it relies on a person’s eyesight and proper lighting, resulting in potential issues with precision and accuracy.

water turbidity measurement
Secchi disks are the earliest and simplest form of turbidity measurement.

Transparency Tube

Another visual tool for the measurement of turbidity is a transparency tube. The tube is clear and features “hatch marks” to measure water depth. At the bottom, there is a stopper with a Secchi disk pattern and a release valve.

The transparency tube is filled with sample water. While looking down into the tube from the top, water is slowly released using the valve until the Secchi disk is barely visible. The remaining depth of water is then recorded. The procedure is typically performed at least twice, and an average value is recorded.

transparency tube turbidity measurement
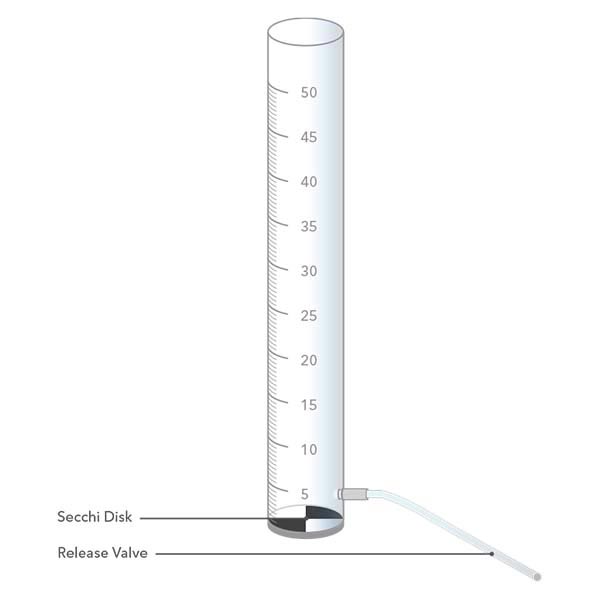
Transparency tubes are similar to Secchi disks, as they have a stopper at the bottom of the tube with a black and white pattern.

Transparency tube values are recorded in distance units, but tables are available for conversion to NTU. However, not all of these tables apply to every field condition – this is a significant drawback of transparency tubes.

Turbidity Meters (Nephelometers)

There are a variety of instruments that measure light scattered by particles in a sample. The differences between them are characterized by:

  1. Light Source
  2. Angle of the Detector(s)
  3. Whether they are Benchtop Meters, Continuous Flow Meters, or Submersible Sensors

Light Source

The two most commonly used light sources are 1) white light and 2) an 860 nm light (near IR). As discussed in the section on Turbidity Units, white light is specified by EPA Method 180.1, and the 860 nm light by ISO7027.

It should be noted that a laser is a third type of light source, but it is less common and will thus not be discussed in detail on this page.

White light is produced by an incandescent tungsten filament light bulb with a color temperature between 2,200 and 3,000 Kelvin. EPA Method 180.1 specifies a light wavelength that’s 400 to 680 nanometers.1

light source color temperature
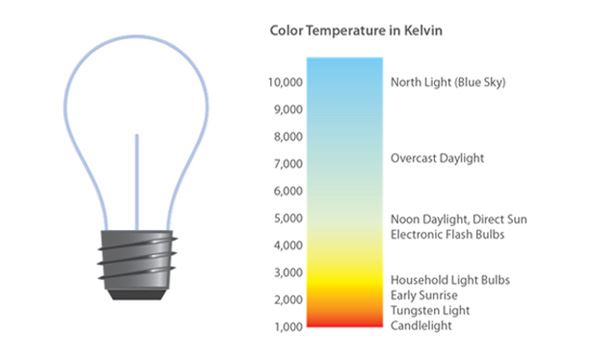
EPA Method 180.1 specifies the light source must be a tungsten lamp with a color temperature between 2,200 and 3,000 K.1

An 860 nm light (near IR) is used by turbidity sensors on instruments such as the YSI EXO and ProDSS. ISO7027 specifies the light source must be a light-emitting diode (LED) with a wavelength of 860 ± 60 nm.1

led light source turbidity sensor
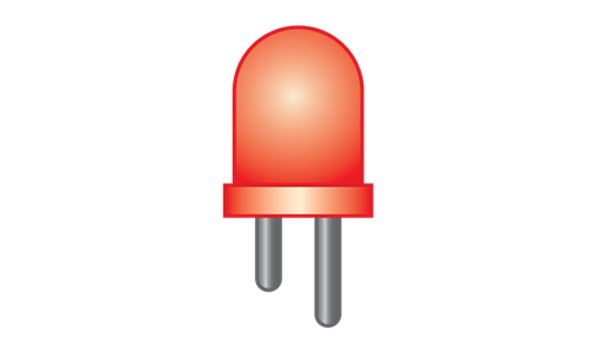
An LED light source – shown here – is specified by ISO7027.

The most obvious reason to select a particular light source is to comply with any regulations. For example, facilities in the United States that must report measurements to the EPA are likely required to use a white light source since it is compliant with EPA Method 180.1.

If you are not required to use a specific light source, there are some considerations to keep in mind when selecting which one to use.

Turbidity measurements are affected by particle size, particle density, and the color of water. A light source that follows ISO7027 eliminates the impact of color on the measurement and minimizes the effects of stray light. In contrast, white light detects smaller particles because it has a smaller wavelength.

Please refer to the section on How to Select the Right Turbidity Instrument for additional guidance regarding the best instrument for your application.

Angle of the Detector(s)

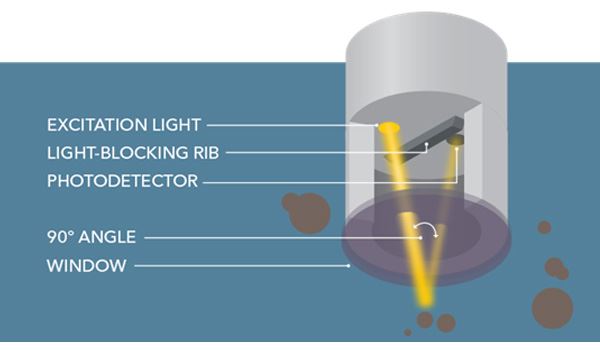
Once the light is emitted from the turbidity sensor, it is scattered by particles in the water. Sensors must have a detector to capture the amount of scatter or absorbance of the light. There are a variety of angles the detector – sometimes multiple detectors – can be placed.

turbidity sensor angle of detector
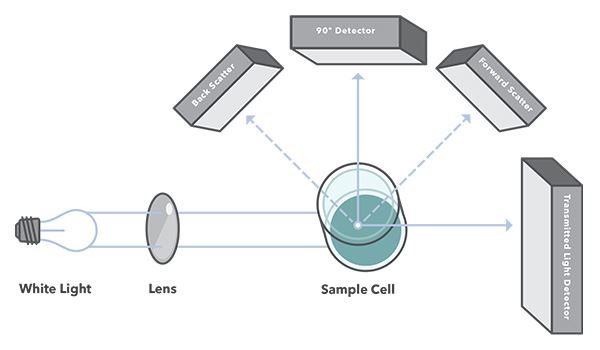
Detectors can be placed at various angles, with 90 degrees being the most commonly used.

A transmitted light detector – this is used by a spectrophotometer – detects all of the light transmitted by a light source except for what is scattered away by particulate matter. This type of detector is typically used in conjunction with a forward scatter detector, resulting in an accurate calculation of low turbidity values.

It is important to note that turbidimetry is technically the measurement of light transmitted through a sample (i.e., a transmitted light detector is used). In contrast, nephelometry measures the light that’s scattered away at an angle.16 However, the term ‘turbidimeter’ is still commonly used to describe instruments that detect scattered light at an angle.

A backscatter detector is typically used when turbidity levels are very high – such as in wastewater treatment – as the decreased light path length allows for reception of more scattered light than any other angle. Backscatter detectors should not be used if the turbidity is expected to be less than 1000 FNU. TSS sensors like the YSI IQ SensorNet ViSolid use a backscatter detector.

The most common angle is 90 degrees from the light source, and this is the angle specified by both EPA Method 180.1 and ISO7027.

turbidity sensor angle of light
Ninety degrees is the most common angle used by turbidity meters, including YSI submersible turbidity sensors.

We mentioned earlier that nephelometry measures the light scattered away at an angle.16To be more specific, the United States Environmental Protection Agency (EPA) defines nephelometry as the measurement of light scattering using a light detector 90 degrees from the incident light.1

So, what’s so special about 90 degrees? It’s all about how light scatters when it contacts particles of different sizes.

light scatter patterns turbidity measurement
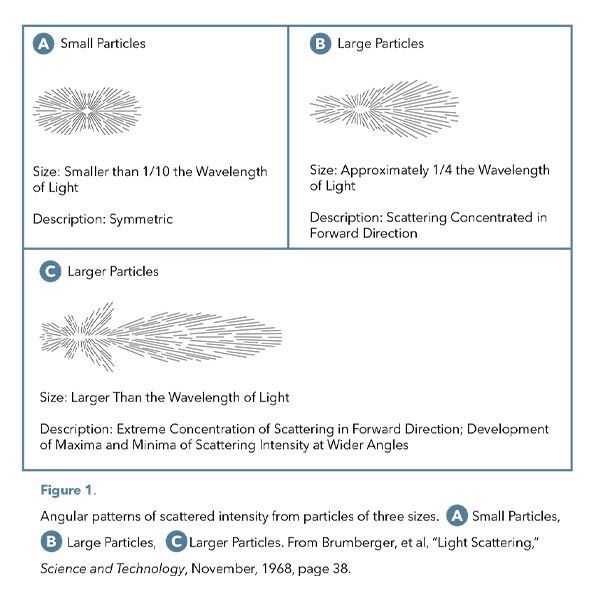
Regardless of particle size, light scatter patterns remain relatively consistent and are minimized at a 90-degree angle.

Small particles produce a symmetrical, peanut-shaped light scatter pattern when light is transmitted through a sample. The particle interference is minimized at 90 degrees.

As particle sizes become larger, the scattering intensity significantly increases, but the scattering intensity is still minimized at a 90-degree angle from the incident light beam source.

In summary, at 90 degrees, there is less interference than at other angles. Also, the longer the distance the light source has to travel, the more accurate the turbidity readings will be at lower levels. The 90- and 180-degree paths are the longest, making them the best for low turbidity readings. However, the path to a backscatter detector is the shortest, making it the best for high turbidity measurements.

It should be mentioned that some instruments combine a variety of angles. This is termed ratio measurement – as opposed to the non-ratiometric methods specified by EPA Method 180.1 and ISO7027 – and it is a non-standardized, manufacturer-dependent way of determining turbidity. Since there is no standardized ratio procedure/method, comparing different instruments’ results is not recommended.

Benchtop Meters

Another significant difference between turbidity instruments relates to the types of samples the instrument will be used to measure.

Benchtop meters are typically used to measure samples that have been collected and brought back to a lab for analysis, although some are portable. An aliquot of sample water is then transferred to a cuvette, and this sample cell is placed inside the meter. A light shines through the cuvette, and the detector determines the amount of scattering caused by particles in the sample.

turbidity meter turbidimeter
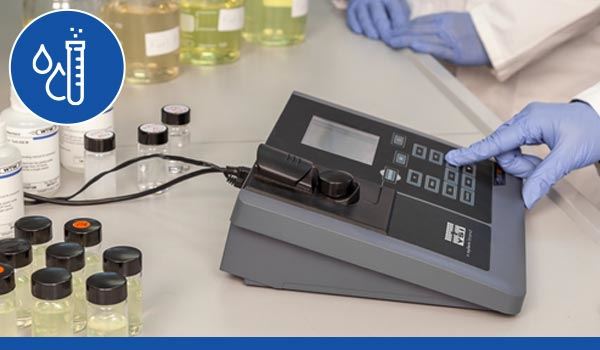
Benchtop meters are ideal for drinking water treatment labs where turbidity values are very low. The YSI Turb750 is compliant with EPA 180.1, as the light source used is a white light tungsten lamp.

It is critically important the cuvette is free of any dust, fingerprints, scratches, or anything else that can interfere with the measurement.

Benchtop meters are intended for use with lower turbidity samples, so they are often used in applications such as drinking water analysis or in beverage production. When used for higher turbidity readings (e.g., greater than 40 NTU), the sample must be diluted according to EPA Method 140.1. This can introduce significant errors in the measurement, so dilution is not recommended unless absolutely necessary.1

Continuous Flow Meters

Rather than placing the sample in a cuvette, a continuous flow meter – commonly called an online turbidimeter – measures turbidity as a constant stream of water flows across the sensor. This type of turbidity meter is most used in drinking water treatment facilities and distribution systems.

As was mentioned in the section Why Measure Turbidity in Drinking Water?, some drinking water facilities are required to measure turbidity at different locations in the facility, such as the combined filter effluent. Online turbidimeters and benchtop meters can be used for this compliance reporting, although it’s essential to select an instrument that follows your required measurement method (e.g., EPA Method 180.1).

The primary advantage of online turbidity meters over benchtop meters is they can continuously monitor for turbidity – there’s no need to collect samples and analyze them in the lab. Collecting real-time data provides a lot of value, as it allows facility managers to respond more quickly to changes in the treatment process.

One disadvantage of online turbidimeters is they are permanently installed at a specific place in the treatment process. If there are five places in the process where turbidity needs to be measured, five different instruments will be required. In contrast, one benchtop meter is all that would be necessary to analyze samples from five locations. It’s important to note that YSI offers benchtop meters such as the Turb750, but we do not offer continuous flow meters.

Online turbidimeters can also be used in the distribution system, where they are often integrated into panel systems that measure other parameters (e.g., pH, chlorine, specific conductance, and temperature).

Submersible Sensors

It is preferred to collect turbidity measurements in situ. Collecting samples and analyzing them later in a lab can cause issues related to biodegradation, growth, settling, precipitation of minerals, and more, although there are methods to help preserve samples.1

turbidity monitoring system
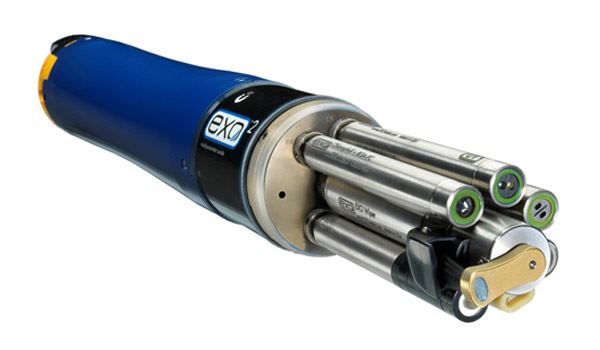
While benchtop meters require the sample to be placed in a cuvette, a submersible turbidity probe can be placed directly in the sample environment. YSI offers turbidity sensors for our EXO (pictured here with various sensors, including turbidity), ProDSS, and ProSwap platforms.

Submersible sensors are portable and can be placed directly in the water (e.g., a stream, an aeration basin in a wastewater treatment facility). Instruments like the YSI ProDSS are designed for spot sampling, while the YSI EXO is intended for continuous, unattended monitoring in many types of environments. We also offer the YSI IQ SensorNet VisoTurb, a turbidity sensor specifically designed for use in a drinking water or wastewater treatment facility.

For some practical guidance on the use of submersible sensors, check out our blog post on Turbidity Measurements: Tips and Precautions.

Want to learn more about turbidity measurement tools? Check out our webinar on How Turbidity Sensors Work!

turbidity sensor parts
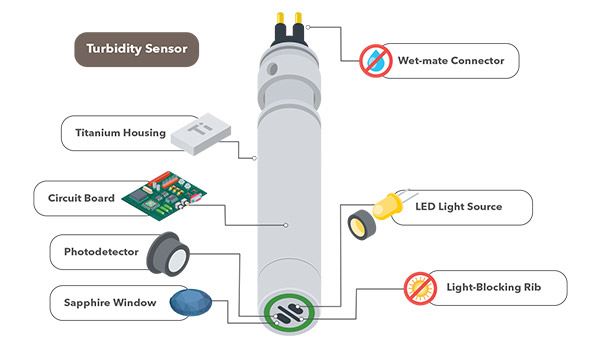
YSI field turbidity sensors transmit light from an infrared LED through the window on each side of the sensor. The light then hits the particles in the water, and portions of the light are reflected back to the sensor. The photodetector is located at a 90-degree angle from the light source and catches the scattered light emitted by the LED.

How to Select the Right Turbidity Instrument?

There are three things to consider when selecting a turbidity instrument.

  1. Compliance with Regulations – if you are required by law to report turbidity readings, you’ll likely have to use an instrument that follows either EPA Method 180.1 or ISO7027.
  2. Measurement Location – this will determine if you should use a benchtop meter or a submersible sensor.
  3. Comparing Readings – if you want to compare readings to those previously collected, the same turbidity measurement method should be used.

Compliance with Regulations

If you need to comply with EPA Method 180.1, you’ll need a turbidity benchtop meter like the YSI Turb750

Tungsten lamps – the type of light source that complies with EPA Method 180.1 – require a lot of power and have a shorter lifespan than infrared LEDs, making a tungsten lamp all but impractical to use on submersible sensors.17 Therefore, if a submersible sensor is compliant with any standard, it is typically ISO7027.

There are also benchtop meters that are compliant with ISO7027. While YSI does not offer one, another Xylem brand does – check out the WTW Turb750 IR.

Measurement Location

Lab

Benchtop meters like the Turb750 are best to use when analyzing samples that have been collected and brought back to the lab. They are also the ideal type of instrument when the water has low turbidity levels, as benchtop meters are more accurate than submersible sensors in the lower range. A common application where benchtop meters are used is drinking water treatment and beverage production facilities.

turbidity meter benchtop sample
Benchtop instruments like the YSI Turb750 are used to measure samples in the lab

If you are NOT required to use a specific turbidity measurement method, but you’re trying to choose between benchtop meters that follow EPA Method 180.1 (e.g., YSI Turb750) or ISO7027 (e.g., WTW Turb 750 IR), it’s important to know there are some differences.

As mentioned in the section on Light Source, turbidity measurements are affected by particle size, particle density, and the color of water. A light source that follows ISO7027 eliminates the impact of color on the measurement and minimizes the effects of stray light. In contrast, white light detects smaller particles because it has a smaller wavelength.

Field

Submersible sensors are the ideal turbidity monitoring tool when measuring in situ, like in a stream, lake, or ocean. Compared to benchtop meters, they are not as accurate in low turbidity samples, but they have a wider measurement range and are very convenient to use – just place the sensor in the water and take a reading!

YSI offers turbidity sensors for the ProDSS and EXO platforms. The ProDSS is a portable system with a handheld, single cable, and a bulkhead where the sensors are installed. This is a true field instrument – rugged, waterproof case (IP-67 rated); metal, military-spec (MS) cable connectors; and titanium sensors. This instrument is meant for spot sampling, meaning it is not meant for unattended monitoring.

water sampling turbidity
The ProDSS is a portable multiparameter field instrument that measures turbidity. It is ideal for many outdoor water quality spot-sampling applications.

The EXO sonde is similar to the ProDSS, but it features more sensors (e.g., the NitraLED) and is designed for continuous, unattended monitoring in many types of environments. It has onboard batteries, data logging, and an onboard wiper, all of which allow for months-long deployments in harsh environments. This is the most advanced outdoor water quality monitoring platform we offer. Not convinced? Check out our blog post on Bayou Sorrell | An Unexpected Bonus with EXO Sondes.

continuous unattended water monitoring turbidity
The EXO is a multiparameter sonde that measures turbidity and a suite of other water quality parameters. The EXO is our premium outdoor water quality platform equipped with features ideal for continuous unattended monitoring.

We also offer the YSI IQ SensorNet VisoTurb, a turbidity sensor specifically designed for use in a drinking water or wastewater facility. This nephelometric sensor measures scattered light at 90 degrees; it is typically deployed directly in process water.

Since many process waters can be highly polluted – especially in wastewater treatment – the VisoTurb is ruggedly constructed with a stainless steel body and sapphire measurement window to withstand high solids. In addition, this sensor includes ultrasonic cleaning, which continually vibrates the measurement window to discourage solids buildup. Common applications include pre- and post-filtration in drinking water facilities and effluent monitoring of wastewater facilities.

Another option for in situ turbidity readings is a Secchi disk. Although visual sensors have drawbacks – read more about Visual Tools (insert jump link) – they are much cheaper than nephelometers (i.e., turbidity meters). Like the ProDSS, a Secchi disk is meant for spot sampling, not long-term unattended monitoring.

Comparing Readings

Turbidity instruments with different designs – such as different light sources and/or detectors – may not produce comparable results. Therefore, if you have a turbidity data collection program and want to continue building a database, it is strongly recommended to purchase an instrument that uses the same methodology as your previous turbidity tool.

As an example, the YSI 6-Series and EXO turbidity sensors use the same measurement method. Our 6-Series sondes are now discontinued, so if you’d like to continue collecting continuous turbidity data, we would recommend the EXO sonde.

In summary, if you compare results between different turbidity instruments, be sure they are using the same measurement method.

Still unsure how to select the best turbidity instrument for your needs? Ask our experts or schedule a free virtual consultation today!