Chemical Oxygen Demand Wastewater Monitoring
Background
Organic carbon is relatively abundant in untreated municipal wastewater and a critical concern for operators of Water Resource Recovery Facilities (WRRF). Organic carbon in treated wastewater is consumed by bacteria and other organisms using dissolved oxygen (DO) in receiving waters. If the concentration of organic carbon in treated wastewater is too high, receiving water DO may be depleted which threatens supply, environmental, and recreational uses for the water body.
Indeed, air (oxygen) is deliberately injected into wastewater by WRRFs to convert organic carbon into bacteria which can be removed by settling or filtration. It is not surprising, then, that the most common measurements of organic carbon in wastewater are not direct measurements of organic carbon. Instead, Biochemical Oxygen Demand (BOD) and Chemical Oxygen Demand (COD) measure the amount of oxygen that is consumed by the reaction of organic carbon with bacteria or chemicals.
Monitoring of BOD has a long history and, at least in the US, has very important, practical consequences. WRRFs are required to monitor BOD in the influent and the effluent as a requirement of their NPDES discharge permits. Secondary treatment standards require that 5-day BOD (BOD5) in effluent is less than 30 mg/L as a monthly average and that a minimum 85% removal of influent BOD5 is achieved. Furthermore, historical records of BOD5 are indicative of the relative strength of the wastewater and the level of treatment required which is useful for design purposes.
Conversely, BOD5 is not useful for process monitoring and control due to the 5-day laboratory test procedure required. Direct, online measurement of BOD5 is not possible. Alternatively, online respirometers which can provide readings in as little as 10 minutes are available but may not be worth the complexity and cost unless wastewater toxicity is a persistent issue. Otherwise, there are simpler methods of process monitoring.
Measurement of Chemical Oxygen Demand has some big advantages over BOD for process monitoring. For one thing, the analysis time is much shorter. The laboratory method requires only about 2 hours. Direct measurement online with a cabinet analyzer is also possible with measurement intervals as short as 1 minute. Another advantage is that COD can be fractionated, for example, into total and dissolved fractions which can be important for monitoring biological nutrient removal (BNR). (Watch, Biological Nutrient Removal of Nitrogen). The COD method also has a few drawbacks. For instance, the laboratory method uses hazardous chemicals which require safe disposal. However, the biggest disadvantage may be a lack of familiarity.
What's the Difference Between COD and BOD?
Operators in the US are trained to think in terms of BOD. Therefore, it is critical to understand the difference between COD and BOD. The aggressive nature of chemical oxidation in the test procedure means that the chemical oxygen demand test is a measure of virtually all degradable organic carbon. On the other hand, BOD is a measure of only the portion of organic carbon which is biologically degradable over a specific time period, 5 days in the case of BOD5.
For this reason, the COD of a sample will always be greater than the BOD. The typical ratio of COD/BOD5 for untreated municipal wastewater is 1.8 to 2.2. The COD/BOD5 ratio increases from the influent to the effluent as the biologically degradable portion of the carbon is consumed but the organic carbon which is not biologically degradable does not change. As a result, the COD/BOD5 ratio for treated wastewater may be as high as 10. It is worth noting that the BOD and COD for municipal wastewater sampling locations are usually positively correlated; BOD increases and decreases proportionally with COD such that once the correlation is defined, the measurement of one can be used to estimate the concentration of the other.
Optical sensors which measure directly the optical properties of the wastewater are generally considered more desirable than cabinet analyzers which require sampling systems and reagents. An optical sensor costs less to acquire and ownership costs are less because there are no reagents to replenish. They are much more simple mechanically. A sampling system is not required nor is a heated cabinet. Finally, they are more versatile.
Optical sensors can be immersed directly in the sample anywhere in the facility providing a nearly instantaneous measurement. It is also possible, using an optical spectral type of optical probe, to monitor multiple parameters simultaneously, for example COD, nitrate, and nitrite with the same instrument. (Learn more, Top 5 Questions When Selecting UV or UV Vis Sensors). A typical analytical instrument used in the water profession provides a measurement of a single, discreet parameter, e.g. dissolved oxygen, hydrogen ion, ammonia. It is not intuitive how a single probe can provide a measurement of an aggregate parameter which is the sum of many and varied oxygen-demanding substances in wastewater. It is fair to say that the availability of an optical, immersible sensor for measurement of biochemical oxygen demand and chemical oxygen demand is enthusiastically welcomed by WRRF operators. However, because it functions so differently from the traditional measurements, some explanation is warranted.
The measurement principle of an optical COD sensor is demonstrated in Figure 1. The intensity of a light source is weakened in proportion to the concentration of light-absorbing substances in the sample. Organic compounds absorb ultraviolet light, the range of the electromagnetic spectrum from 200 to 390 nm. The simplest form of measurement using this principle is the Spectral Absorption Coefficient (SAC) which measures the absorption of light at a specified wavelength.
Traditionally, a wavelength of 254 nm is used, because it is in the region where organic matter strongly absorbs and where mercury lamps exhibit a prominent ultraviolet emission. The lower the absorption, measured in 1/m representing the decrease in intensity per meter of sample depth, the lower the organic contamination. In this way, the SAC254 of a sample can be used directly as a measure of organic contamination even though it is not a true measurement of COD or BOD. SAC can also be used to calculate COD or BOD indirectly if it can be correlated with laboratory measurements.
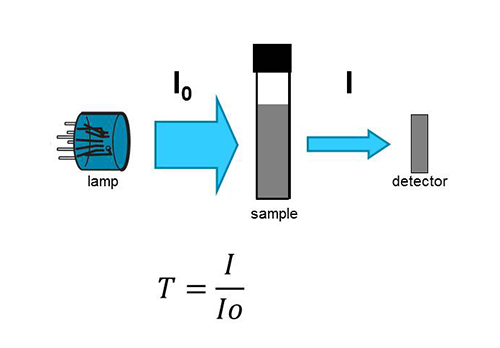
Figure 1. Measurement principle of an optical sensor
One disadvantage of measuring only 1 wavelength is that accuracy decreases when the wastewater composition is different from the calibration conditions. Wastewater samples are complex containing many different compounds. Various organic substances have different levels of absorbance at 254 nm. Furthermore, some non-organic substances also absorb at 254 nm. As the composition of the sample changes, the correlation becomes weaker. A better correlation can be achieved by estimating the relative proportions of various components through the measurement of additional wavelengths besides 254 nm.
An optical spectral sensor measures sample absorption for dozens of wavelengths over a large range of the ultraviolet and visible spectrum. The design is similar to a single wavelength sensor but the optics are different and the electronics are more complex. A Xenon flash lamp and multidiode array detector are used to emit and measure a wide range of wavelengths. A calibration is programmed into the electronics to translate the multiple absorbance measurements from each scan into a value for COD. Each application generally requires a separate program. For example, a sensor programmed for untreated wastewater would display a different result than a sensor programmed for treated wastewater for the same sample.
A CarboVis® 701 was deployed at a municipal WRRF in central Ohio receiving primarily domestic wastewater for the purpose of demonstrating the use of an optical spectral sensor to monitor untreated wastewater. The CarboVis measures the transmittance of the sample for 256 individual wavelengths and calculates the COD concentration using programmed algorithms. Algorithms for “influent”, “activation”, and “effluent” for monitoring municipal wastewater are programmed into the 701 version. The sensor was deployed in a raw wastewater equalization basin and programmed to display COD total, BOD, and SAC254 total using the “influent” algorithm. Datalogging was set up to continuously record sensor measurements. Grab samples were collected at routine intervals from near the sensor and analyzed for COD and carbonaceous BOD5 (cBOD5). The sensor includes built-in UltraClean ultrasonic cleaning. Supplemental manual cleaning was performed every week to 10 days. The cleaning routine was very effective as drift of the measurement on account of fouling was not observed during the 4-month demonstration period.
Spectral Absorption Coefficient (SAC)
The SAC254 values displayed and recorded by the monitoring system are shown in Figure 2. The SAC trend appears to reflect a typical diurnal curve for municipal wastewater. The lowest values occur in the early morning hours when loading is low and two peaks are observed in the mid-morning and early evening when loadings peak consistent with increased domestic activity during those periods. This is very useful information to help operators know when peak loadings will occur and when to adjust aeration. The drawback is that the measured value in 1/m does not have practical meaning to wastewater professionals accustomed to thinking in concentration units.
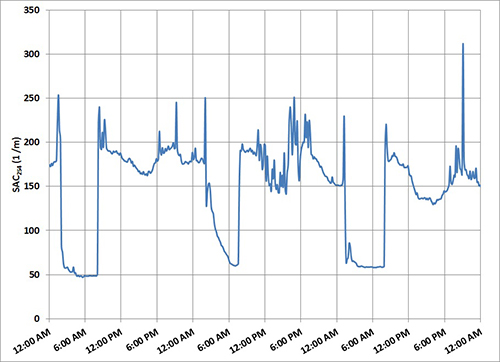
Figure 2. SAC254 measurements recorded by CarboVis sensor
Monitoring SAC254 may be sufficient to improve operational efficiency for small WRRFs with consistent loadings using primarily manual (open loop) control. For larger facilities with varied sources of influent and/or stringent treatment requirements, the SAC may fail to capture important characteristics of the wastewater. It is important to note that display of the SAC correlated COD is not possible with the CarboVis or other spectral sensors of the IQ SensorNet which include an alternative for direct measurement of COD. Display of COD is possible in the UV 70x IQ SAC single-wavelength sensor.
COD - Chemical Oxygen Demand
The benefit of using the sensor algorithm for COD is higher accuracy and improved dynamic response. The CarboVis factory calibrated COD and SAC are shown in Figure 3 demonstrate similar trends despite the variability of individual measurements. It is also clear that the factory COD shows a much more dynamic response possibly due to variability in the composition of the wastewater. The main difference in the readings is that the COD value spikes during overnight hours whereas the SAC254 is minimum. The explanation is that the EQ basin is drawn down during low flows such that the sensor is no longer submerged resulting in a large error in the programmed COD calculation.
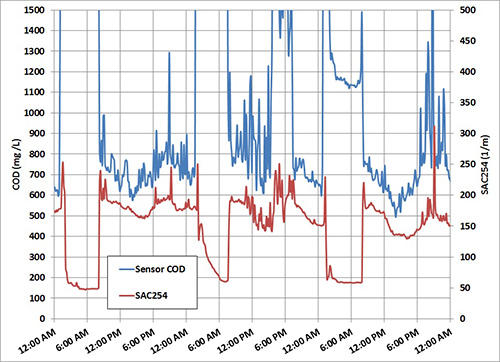
Figure 3. Comparison of COD and SAC254 measurements recorded by CarboVis sensor
A 2-point value pair calibration that pairs the sensor raw value with a laboratory reference measurement can be entered in the settings menu to provide a higher level of accuracy for applications in which the sample matrix is not a close match for the programmed calibration. The sensor raw value, denoted with a #, corresponds to the factory calibration and is the second measurement displayed on the right side of the IQ SensorNet 2020 display window. The main value will differ from the raw value if a user calibration is implemented.
Analysis of COD in grab samples is required to verify the factory calibration and can be used to develop a user calibration if necessary. The raw value should be recorded manually at the time of sampling with signal smoothing set to ‘off’ to display the instantaneous reading from the sensor. The response time (t90) of the sensor is set for 10 minutes to 60 minutes with signal smoothing ‘on’. The displayed measurement may vary widely with signal smoothing ‘off’ as the sensor updates the measured value each measurement cycle (approximately 1 minute). Therefore, it is recommended to record the raw value for several minutes before and after sampling because an instantaneous measurement may not be representative for samples like untreated wastewater that are not homogeneous. Logged data can also be utilized but remember to set the logging interval to 1 minute.
Once the reference measurements are obtained, the next step is data screening. Select the most representative raw value to pair with each reference measurement and plot versus the laboratory reference values. Outliers can be identified from visual inspection. This step is greatly facilitated using the free workbook tool “advanced value pair calculation spectral sensors_US.xlsx” available from YSI. A plot of reference measurements vs. COD sensor raw values (blue diamonds) is shown in Figure 4 together with the linear trendline (black line), the equation of the trendline, the calibration calculated from the data (red dashed line), and the calibration value pairs (the square red markers).
The reference measurements were made from grab samples taken during the study. The r2 value also shown on the chart indicates how well the calibration fits the data on a scale from 0 to 1 with 1 being a perfect correlation. The workbook also calculates the calibration that best fits the data.
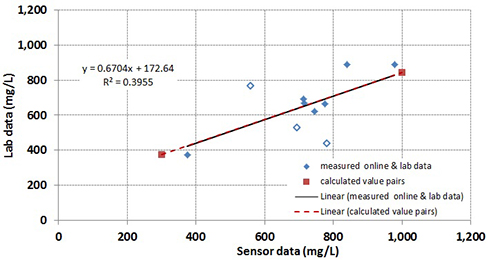
Figure 4. COD sensor values vs. laboratory reference measurements
Improvement of the user calibration can be achieved by removing any outliers which are outside the trend of the whole dataset. Outliers may occur for many reasons including errors in sampling and measurement or transient conditions affecting the sample. The three points which are circled in Figure 4 were removed from the dataset by visual inspection. The plot in Figure 5 demonstrates the improvement in the measurement. The value pair calibration improved the accuracy of the sensor COD measurement as shown in Table 2. Four out of seven samples are within 5% of the laboratory measurement and only 2 samples have a difference greater than 10%. The correlation (r2) was increased up to 0.9.
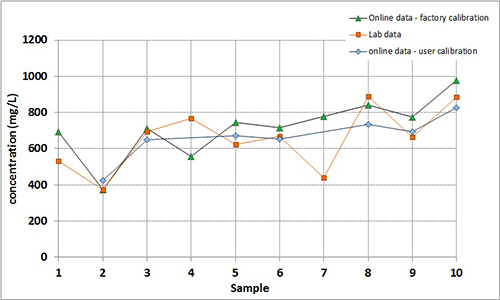
Figure 5. Comparison of COD user calibration with factory calibration and lab reference measurements
The updated user calibration with the outliers removed is shown below.
Updated User Calibration
| |
Sensor Value (#) |
Reference Measurement (mg COD/L |
| Value Pair #1 |
300 |
295 |
| Value Pair #2 |
1000 |
924 |
The sensor values are chosen by the customer and the reference measurement is automatically calculated by the workbook. The updated calibration does not match the factory calibration perfectly. The value pairs for the factory calibration are 0 (raw), 0 (reference); 10 (raw), 10 (reference). This could be the result of a bias in the sampling and measurement technique or a difference between the sample matrix and the programmed calibration. The wastewater at the demonstration site is primarily domestic wastewater from a golf course community. However, there is a significant influence at certain times of the year from the golf course operations. Furthermore, the on-site aerobic digester is decanted directly into the wastewater equalization basin where the sampling point is located.
Table 1. Comparison of corrected COD sensor values and laboratory reference measurements
| Sample ID |
Corrected Sensor Value (mg COD/L) |
Laboratory Reference Measurement (mg COD/L) |
% Difference |
| 3 |
362 |
372 |
-2.7% |
| 4 |
665 |
693 |
-4.0% |
| 6 |
695 |
623 |
11.6% |
| 8 |
668 |
668 |
0.0% |
| 10 |
780 |
888 |
-12.2% |
| 11 |
722 |
664 |
8.7% |
| 12 |
903 |
887 |
1.8% |
BOD - Biochemical Oxygen Demand
The CarboVis does not include a factory calibration for BOD. Instead, the measurement of BOD is implemented as a correlated parameter. The displayed values for COD and BOD are the same for a system when the monitoring system is first installed. This is disturbing to many customers who understand that there is usually a large difference in two values. The explanation is that the mathematical algorithm programmed into the sensor was developed based on the spectral properties of the samples and COD reference measurements from a months-long sampling campaign. A factory calibration for BOD is not programmed into the sensor.
Therefore, the BOD sensor raw value is the same as the COD sensor raw value. However, an accurate estimate of BOD is possible if it is correlated with COD, which is a valuable feature in the US where BOD is a much more common monitoring parameter than COD. The procedure is the same as for the value pair user calibration described above for COD using the sensor raw values with laboratory reference measurements for the BOD parameter desired.
A user calibration was prepared for carbonaceous 5-day BOD (cBOD5). Sensor raw values and laboratory reference measurements are shown in Table 2. Sample ID numbers correspond to the same numbers shown for COD. Two laboratories were used in order to increase the total number of data points. Laboratory A was the utility laboratory that ran BOD tests only on certain days. Samples were split and sent to both labs for quality assurance whenever possible. Samples were sent only to Laboratory B, a commercial lab on days that the utility laboratory was not running BOD tests.
Comparison of the measurements from both labs demonstrates a requirement for continuous monitoring with online sensors. Reliable sensor performance cannot be guaranteed without quality laboratory reference measurements. In this case, the measurements from both labs could not be combined because of the large differences in the measurements from the two labs in some of the measurements on split samples. This is disappointing but not that surprising given the complexity of the BOD test. In this case, the Laboratory A cBOD5 measurements are selected for calibration because the sensor raw values were more strongly correlated with the Laboratory A measurements. The calibration would be different if the Laboratory B reference measurements are used instead.
Table 2. Sensor raw values and laboratory cBOD5 reference measurements
| Sample ID |
Sensor Raw Value (#) |
Laboratory A (Utility) Reference Measurement (mg cBOD5/L) |
Laboratory B (Commercial) Reference Measurement (mg cBOD5/L) |
| 1 |
693 |
164 |
-- |
| 2 |
365 |
99 |
-- |
| 3 |
375 |
108 |
120 |
| 4 |
712 |
-- |
260 |
| 5 |
558 |
-- |
290 |
| 6 |
745 |
173 |
250 |
| 7 |
707 |
-- |
180 |
| 8 |
715 |
180 |
180 |
| 9 |
780 |
-- |
210 |
| 10 |
840 |
146 |
180 |
| 11 |
775 |
144 |
250 |
| 12 |
977 |
-- |
290 |
-- No Sample Submitted to Lab for Analysis
A value pair calibration was created from the sensor raw values and Laboratory A measurements. Samples 10 and 11 were removed from the analysis as outliers (see discussion above for COD). The linear trendline from the 5 samples remaining with outliers removed is 0.98 indicating a very strong correlation.
The calibration shown below was calculated.
Calibration
| |
Sensor Value (#) |
Laboratory Reference Measurement (mg cBOD5/L) |
| Value Pair #1 |
300 |
90 |
| Value Pair #2 |
1000 |
228 |
Summary
Monitoring of organic carbon in wastewater is critical to achieving treatment objectives, especially for nutrient removal. Sufficient organic carbon is required for denitrification processes that convert nitrate-nitrogen to nitrogen gas and for phosphorus removal processes that convert soluble P to particulate P. The CarboVis IQ 70x provides municipal WRRF operators a fast and reliable method to monitor organic carbon as COD and BOD using optical spectral technology.
A CarboVis 701 IQ sensor was deployed in the raw wastewater equalization basin at a small WRRF in Central Ohio to demonstrate the technology. The carbon parameters SAC254, COD, and cBOD5 were measured and displayed simultaneously. Monitoring of SAC254 captured the diurnal fluctuation in wastewater loading. A similar trend was observed with the sensor COD although it displayed a more dynamic response due to the higher resolution of the spectral measurement. Besides, the COD value in mg/L is more understandable to wastewater professionals. The factory calibration for COD was adjusted slightly with reference measurements from grab samples to account for differences in the sample matrix. Sensor cBOD5 was found to be correlated with sensor COD allowing for a calibration for cBOD5. Large discrepancies in the reference measurements from the two labs utilized limited the number of reference measurements.
The CarboVis 701 used in this study has a 1 mm measuring gap for measuring untreated wastewater or wastewater with high solids concentrations. The CarboVis 705 model with a 5 mm measuring gap is recommended for treated wastewater applications but only the “effluent” algorithm is programmed into the sensor. Both models have the additional capability to monitor dissolved COD according to a factory calibration and total organic carbon (TOC) and dissolved organic carbon (DOC) as correlated parameters like BOD. Dissolved parameters provide an estimate of the concentration of readily degradable carbon which is an important parameter for biological nutrient removal (BNR). TOC and DOC are commonly monitored in water reuse applications. NiCaVis models have the capability to also monitor nitrate and nitrite.

Additional Blog Posts of Interest
Operational Efficiency with SCADA and Continuous Process Monitoring
How Does the IQ SensorNet Help Wastewater Operators Sleep Better at Night?
Reliable Ammonium and Nitrate Measurements from Online ISE Sensors
Water Reclamation Facility Meets Discharge Limits for Total Inorganic Nitrogen