Phycocyanin in HAB Monitoring: Dispelling Three Myths
If you’ve ever taken in one of my harmful algal bloom (HAB) webinars, blogs, or conference presentations, you’ve likely heard me extol the virtues of monitoring not just for chlorophyll, but also for the pigments phycocyanin (PC) or phycoerythrin (PE). Most people agree with this basic premise: chlorophyll is found in all algae, but since phycocyanin and phycoerythrin are more specific indicators of blue-green algae (cyanobacteria) these “accessory pigments” should be included for a robust HAB monitoring program.
There has always been limited time and space to provide further biological context for pigments in nature, though, and how that affects HAB monitoring. (Learn more, Answers to the Top 5 HAB Monitoring Questions). A few years ago, I address some of the common questions that arise from this lack of context. But I find that there are three misunderstandings that continue to persist, in part even because of things I gloss over in my webinars:
- PC and PE are only found in blue-green algae,
- PC is only found in freshwater blue-green algae and that PE is only found in marine blue-green algae,
- An environmental sensor delivers accurate measurement of pigment concentration in the water.
The root cause of these myths is that algal pigments are still mysterious to most of us, and as a busy professional you probably are not going to wade through publications and books about biophysics and photosynthesis unless maybe you’re a professor or graduate student and it’s part of your everyday job. Yet, it’s important to have some knowledge to have confidence in your HAB monitoring program, whether you’re using YSI’s sensors or anybody else’s.
I spent some time in the past couple of months updating my own knowledge on pigments, and in the spirit of what might be our most frequently-visited blog of all time, The Basics of Chlorophyll Measurement in Surface Water, I want to deliver here the basics of using PC in HAB Monitoring and will tie the biological and biochemical fundamentals back to these myths. Let’s start with some pigment fundamentals.
1) How is Phycocyanin Different From Chlorophyll a?
There are three major classes of pigments that support photosynthesis in algae: carotenoids, biliproteins, and chlorophyll. They are densely packed into and around membranes of algae, working in concert to gather as much light as possible to fuel photosynthesis, as well as to protect the algae from getting too much sun. The carotenoids in particular perform a protective function, but since this blog is about PC we won’t talk about carotenoids going forward.
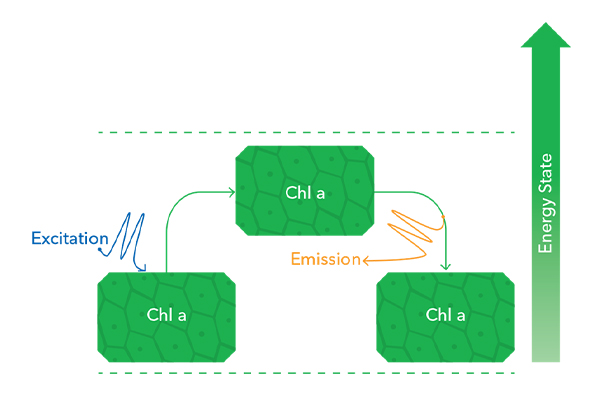
All three pigment classes are fluorescent molecules, meaning that they can absorb light of one wavelength, and release light of a longer (lower energy) wavelength.
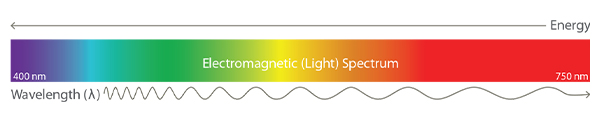
The absorbance and release of light energy by fluorescent molecules are called excitation and emission, respectively. As an example, chlorophyll is excited by high-energy blue light, and when it returns to its normal energy state the excess energy is emitted a red/orange light. That light is of a longer wavelength and lower energy content than blue light.
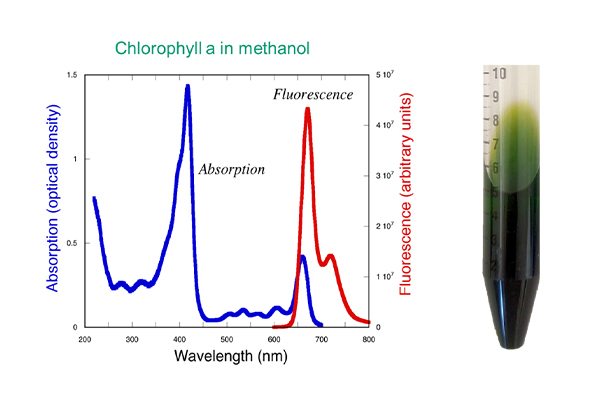
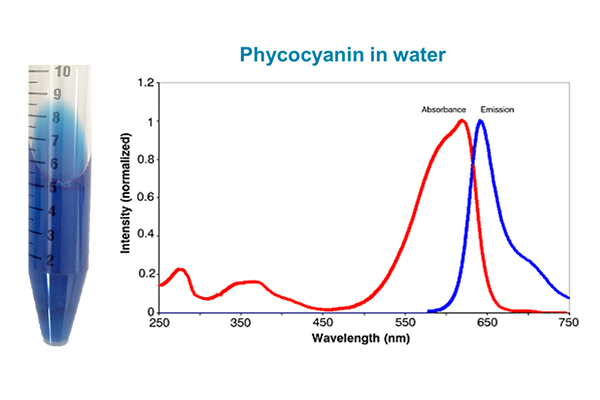
The biliproteins, PC, and PE absorb at higher wavelengths (greenish-orangish). This is just one way that the biliproteins differ from chlorophyll. The excitation and emission patterns for chlorophyll and phycocyanin in their purified form are shown below, alongside tubes of pigment from my own extractions, performed years ago in my laboratory (back when I had my own lab!). We’re going to return to these pictures—do you notice anything different in the graphs besides just the wavelengths?
Let’s take a moment to talk more about biliproteins: phycocyanin (PC), phycoerythrin (PE), allophycocyanin (APC), and phycoerythrocyanin (PEC). The fact that there are four of these accessory pigments may be your first surprise since we rarely talk about APC and PEC. APC is found in most of the blue-green algae, PEC is less common. On a per-cell basis, APC and PEC are typically less abundant than PC and PE, which is one reason they are not as useful to us for environmental HAB monitoring. There can be a number of minor variations of each chromophore and the proteins, and PC, PE, APC and PEC actually represent families of biliproteins.
Besides the different excitation/emission patterns, the PC and chlorophyll a differ in another very important way. Chlorophyll is a chromophore, which is a molecule that is colored. Even though found in huge assemblages of proteins and membranes, chlorophyll can be isolated as a discrete molecule in its own right.
Biliproteins are different. They are actually proteins. The fully functional structure consists of multiple polypeptide subunits with a phycobilin, the actual chromophore, covalently attached to the protein. For example, below are the structures of chlorophyll and phycocyanin chromophores—the structures that absorb/emit light and which impart the characteristic colors of green and blue that we associate with these pigments.
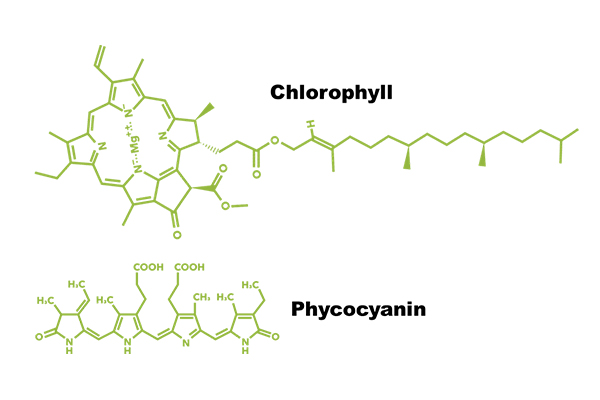
In the case of the pigment we call chlorophyll a, that’s the structure: it has a long lipophilic (fat-loving) tail and is complexed with a Magnesium ion that helps facilitate the transfer of an electron into the splitting of water for photosynthesis. The lipophilic tail also anchors chlorophyll in the cellular membranes of the algae, which are made of phospholipids like most other biological membranes. In photosynthetic organisms, there are layered membranes called thylakoids, which is where we find loads and loads of chlorophyll.
Phycocyanin’s chromophore obviously lacks that lipophilic tail, but further the chromophore is found complexed with a number of polypeptides that form the full biliprotein that is actually phycocyanin. So the structure above is just the chromophoric part of phycocyanin. There are numerous examples of the full protein structure online; if you’re curious, I like this 2016 paper by Gupta et al. (RS Advances, 81(6):77898) because it nicely visualizes the chromophore sitting in the polypeptides. I’m also a fan of Sonani et al., who show beautiful excitation-emission structures for PE, PC, and APC (World J. Biol. Chem., 2016, 7:100-109).
In the cell, biliproteins and chlorophylls form a structure called the phycobilisome, the “light-harvesting antenna” of the cell. As mentioned above, the biliproteins absorb at higher wavelengths (greenish-orangish), but what is more important is that the light they emit is often in a range of wavelengths that can be absorbed by other accessory pigments. This light-transferring “hand-shake” enables assemblages of pigments in or near the membranes of algal cells to act like antennae that collects multiple wavelengths from a broad range of visible light and funnel the energy towards chlorophyll, boosting photosynthesis.
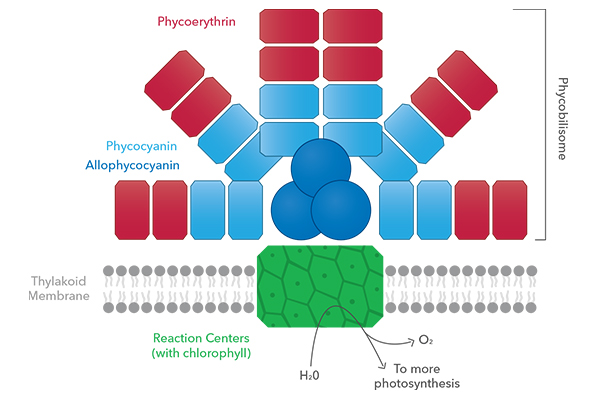
So to close off this section, the PC and PE blocks in the phycobilisome diagram above are actually proteins, but the chlorophyll block is just the chromophore itself, anchored in the thylakoid membrane via its lipophilic tail. Secondly, the PC (and PE and APC) all have different excitation/emission spectra, and will gather wavelengths of light that chlorophyll can’t absorb, but emit wavelengths that other pigments and chlorophyll can absorb. In this way the cell casts a wide net for catching sunlight, assuring the energy needed for photosynthesis and growth of the algae is obtained. Finally, in addition to the structures (protein vs. standalone chromophore) and excitation/emission patterns, there is a third major difference: Biliproteins are water-soluble, chlorophylls are not.
These properties all affect how we measure phycocyanin, both in the lab and in environmental waters, as we will see below.
2) How is Phycocyanin Measured?
Interesting side note—blue is really uncommon in nature as far as pigments go. A natural blue colorant like phycocyanin, then, has great potential value in the food and textile industries. For this reason, a lot of effort has been put into methods for extracting, measuring, and purifying phycocyanin (Siegelman et al., Algal Biliproteins in Handbook of Phycological Methods, Cambridge University Press 1978; Zhu et al., Appl. Microbiol. Biotechnol. 74:244, 2007 are two good references).
Because it’s water-soluble PC is not hard to extract. A mass of algal cells can be frozen and thawed in repeated cycles, and the pigment ends up in the water. It’s not a highly purified extract, and the pigment is not super-stable in that form, and you don’t get 100% recovery. But the blue tube in the picture earlier in this blog was obtained by doing just that, using a Microcystis-dominated scum that was collected in a lake in Ohio by your humble author. Of course one can strive to obtain a highly purified extract using chromatographic separations that will be familiar to protein biochemists, and a nice summary of methods to do so was provided by Sonani et al. (World J. Biol. Chem., 2016, 7:100-109).
Its ability to absorb light makes PC easily measurable using a spectrophotometer or a fluorometer in a laboratory, leveraging the spectral properties shown in the table below.
| Excitation max |
621 nm |
| Emission max |
642 nm |
| Extinction Coefficient |
1.54x10⁶/M/cm |
Spectrophotometry requires a fairly high concentration of the pigment, and one of my favorite books, Rowan’s Photosynthetic Pigments of Algae (Cambridge University Press, 1989), describes numerous methods for making corrections of spectrophotometric measurements to account for other pigments or impurities that might be in the extract. These methods are still valid today.
What has evolved tremendously since Rowan’s book is the use of fluorescence for quantifying pigments, preferred because of its exquisite sensitivity, and excellent specificity because of the pigment-specific excitation/emission wavelengths that can be used. Fluorescence is the basis for YSI’s sensors.
I have delivered a number of webinars describing environmental sensors for algae—my favorite is 2019’s How Algae Sensors Work. Others can be found at our HAB video hub, which contains a lot of YSI’s algae-related webinars and presentations, and more mature users might find some of the older (2017-2018) webinars interesting because I explain the differences between the 6-series sensors and the EXO sensors. I also take on that topic, and other challenging questions about algae monitoring, in a follow-on blog.
In a nutshell, each EXO Total Algae sensor has two channels—one for chlorophyll and one for either PC or PE. There is an LED that excites chlorophyll, and there is an LED that excites PC, and there is one photodetector. The photodetector is tuned to detect light coming from chlorophyll. So when PC is excited, that handshake we talked about above takes place, and the light from chlorophyll is due to the passage of energy from PC to chlorophyll. The sensor has algorithms that derive the relative fluorescence units (RFUs) coming from exciting chlorophyll only, or phycocyanin only.
If that sounds pretty nifty, well it is, but there are things I want users to be aware of. Now we’re going to get back to our three myths, and the first one we will tackle regards the accuracy of pigment measurements in the environment.
Measuring Phycocyanin (and Chlorophyll) in the Environment
Remember how I told you we’d return to those pictures of chlorophyll and phycocyanin’s excitation/emission spectra earlier in this blog? Well, that time has come! Scroll back up and take a look at them. Notice that:
- The chlorophyll graph is for the pigment in methanol,
- The PC graph is for the pigment in water.
Congratulations if you noticed this difference when I asked earlier because it’s a pretty big deal for HAB monitoring.
Chlorophyll hates water! But in the environment, we are measuring it in water, while it is embedded in stacks of membranes, and we are using LEDs that target the optimal absorption wavelengths of the pigment that were determined in the extracts. The chlorophyll that is embedded in a membrane and sitting in water does not absorb and emit light exactly the same as it does when extracted from those membranes and sitting in methanol. It’s close, but not perfect.
It is also a reason that the question I hear most often is why an algae sensor’s chlorophyll readings don’t always correlate well with chlorophyll extractions. One can of course build one’s own correlations, which is what we have done for providing μg/L units on the EXO platform. But my correlations, using lab cultures, aren’t going to look like your correlations, using environmental samples. And therefore, the units delivered by the sensor might not align well with your own samples. Sometimes they look great, sometimes not so great. Further notice that YSI’s TAL sensor specifications state linearity, and not accuracy, and the linearity is for a surrogate, rhodamine dye.
Put simply, it would be an impossibility to provide an accurate measurement of non-extracted chlorophyll in a lake using our sensor technology (as well as the tech of others, I might add), and there are other reasons such as the way different organisms regulate their levels of pigments, organic matter in the water, and so forth (again, covered this in some webinars).
As many of you who’ve heard my webinars know, my desire is that YSI would eliminate any sensor unit other than relative fluorescent units (RFU) because that is the closest thing to a true measurement being made with the Total Algae sensor.
Why don’t we, then? Well, because 1) it ends up that YSI doesn’t do everything I want (I know you’re shocked), and 2) many customers are required to report in pigment concentration units by regulatory agencies. In many cases, those agencies have built their own correlations based on the EXO platform, so they have reasonable confidence in the numbers reported. Even with that, I strongly advise building your own correlations if you will use a unit other than RFU for any purposes related to research or if you might shut down a beach, for example.
So, what of water-loving phycocyanin? Indeed, water-solubility means the excitation and emission wavelengths may be closer to what they would be in a lab-extracted preparation when we measure in the environment. However, Rowan’s Photosynthetic Pigments of Algae makes it abundantly clear that some correction factors might be applied for better accuracy, even in laboratory measurements. Note that we do not apply these same correction factors in our sensors.
Rather, YSI has built correlations derived from lab-grown cultures with other laboratory measurements of PC. PC in healthy cells is associated with a number of other proteins in the phycobilisome. It should be expected to behave slightly differently than PC free-floating in water (perhaps released after a water treatment that kills algae). In either state, the association with other pigments, proteins, and membranes will be variable, as will factors like temperature and turbidity, which can affect detection in the water. So again, we have too little control over the environment-based measurement to deliver a highly accurate concentration of pigment.
These are just some of the nuances that biology drives when monitoring for algae in water. How much do they matter for your actual measurement, especially if you are using pigment concentrations rather than RFU? It’s not as bad as it all sounds. My confidence is pretty high that if one day your sensor reads 5 RFU, and the next day it reads 10 RFU, your population of algae is increasing, close to doubling. But am I confident that the population has twice as much of a precise concentration of pigment? Less so…it depends upon those correlations you built for your sensor, and over what RFU range for which you built them.
In other words, the best way to use the sensor, not just YSI’s but any algae sensor, is as a baseline monitoring tool, not as a full replacement for extractions or other methods of algal measurement (including cell concentrations). Use the sensor to assess changes, and then go in with your treatment or follow-on analyses. Combine it with other parameters, such as DO and pH, to fully understand your monitoring environment.
Now, back to phycocyanin and those myths we mentioned at the beginning. This section has addressed the myth that a sensor is providing an accurate measurement of a pigment concentration. While “accurate” is in the eye of the beholder, my belief is that the sensor is providing an excellent relative measurement of how the pigment, as detected by the sensor, is changing in the environment.
Let’s wrap up with the other two myths, regarding the distribution of PC among biological taxa in the environment.
3) Where is Phycocyanin in the Environment?
Recently I heard a presentation by another scientist who described getting a strong PC signal in a system, and it was not from cyanobacteria. Rather it was from a group of algae called cryptomonads.
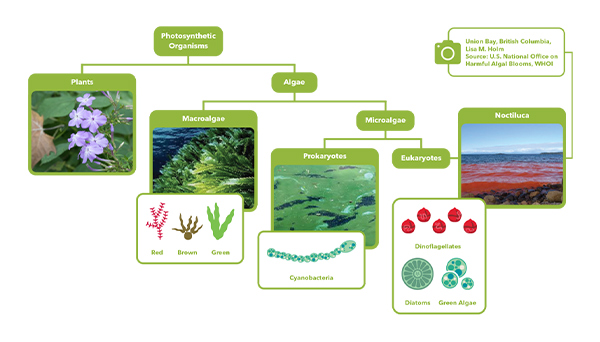
In fact, the biliproteins PC and PE are found in three classes of algae: Cyanophyceae, Rhodophyceae, and Cryptophyceae. The Cyanophyceae are where we find the cyanobacteria, a.k.a the blue-green algae. The Rhodophyceae are red marine macroalgae that have significant importance as a source of food and ingredients used in cosmetics and nutritional supplements. The Cryptomonads are nearly ubiquitous unicellular green algae found in freshwater, brackish, and marine systems. Their unicellular lifestyle means that they behave a little more like cyanobacteria—can be free-floating in the water column (thanks to flagella that they may have during their life cycle). Thus in the graphic below, borrowed from one of my webinars each of the groups of algae represented can have PC and PE!
Oh no! What does this mean for HAB monitoring, and all those times you’ve heard me say that PC and PE are in the cyanobacteria?
Well, it’s usually not a problem. Tying back to our biology, the cyanobacteria and the red algae both contain phycobilisomes, but the red algae are not free-floating in the water. The blue-green algae are largely planktonic meaning that the algae are in the water column, where the sensor would be placed. Further, in the red algae, the pigment pretty much stays put. We can’t rule out that in an area with a lot of red algae, there might be some background PC or PE fluorescence from them. But heck, that could be said for any seaweed or macroalgae. This, again, is why the sensor should be used for baseline monitoring—looking for changes in pigment relative abundance.
The cryptomonads are a special case. They actually have PC and/or PE in granular structures within their cells, rather than in phycobilisomes. That is one way in which they differ from the red macroalgae and the blue-green algae. Unlike the macroalgae, though, they are unicellular and can be planktonic. In this way, they are like blue-green algae. And yes, blooms of crytomonads can happen. In this very nice article, Egerton et al. describe brief but intense blooms of Cryptomonas sp. in the Chesapeake Bay, for instance (Microorganisms, 2014, 2:33-57).
And yet again…this is why the sensor should be used for baseline monitoring rather than as a replacement measurement for the abundance of blue-green algae. The sensor can help to drive the sampling regimen that should be part of any HAB monitoring program.
Finally, this review of the distribution demonstrates that the third myth, regarding the freshwater vs. marine existence of the pigments, is, indeed, a myth. Phycocyanin is abundant in the marine red algae, and PE is found in the freshwater cyrptomonads. There have even been Microcystis species isolated that contain PE.
As mentioned in the intro, and a gazillion blogs, webinars, and other pieces I’ve put out into the world, we advise the use of the TAL-PE to detect marine blue-green algae, and TAL-PC to be used in freshwater environments. However it is not the case that all marine blue-green algae completely lack PC, it’s rather the case that they have very abundant PE and it’s more useful for distinguishing them in a marine environment. Likewise, when it comes to monitoring in a freshwater environment, there is a much higher probability that the organisms of interest will have an abundance of PC, and either no or very little PE.
In sum, as with all things in biology, there are no absolutes when it comes to algae and their pigments. Rather there are probabilities and overriding realities that make pigment sensors highly effective tools that can form the foundation of a HAB monitoring program. I hope this background helps you get the most out of your sensors, and if you have other questions or interesting insights that our readers would like to explore, please comment here.