Answers to Four Challenging Questions About Algae Sensors
(Updated October 2021)
On June 11, 2019, YSI and the Cleveland Water Alliance proudly presented a webinar featuring yours truly and entitled How Algae Sensors Work. It was one of my favorite webinars to date because the audience was so engaged and asked such great questions, even hanging around for an extra 30 minutes so we could keep answering them! In the end, there were more questions than time, so our team thought we’d gather up some of the remaining (and very interesting) questions and address them here, at YSI’s Blog page.
I decided to address application-level questions so as to broaden the scope of the conversation about algae monitoring, and because for each of the questions below, there were multiple identical or similar questions asked, which indicated a lot of interest in these topics. In the interests of time and word count, I avoided questions that could be answered with the EXO User’s Manual, by our great tech support team at info@ysi.com, through our online chat (just look for the orange 'Chat' button at the bottom of any page), or which I may have answered in a prior blog (Read Blog Post: Top 5 HAB Monitoring Questions) or the webinar itself. Similar questions may also have been answered in one of my prior webinars, which can be found on our YSI Video Hub.
Thanks to all of those who attended and made this such a great event, and don’t miss out on the rest of our How Sensors Work series (turbidity, conductivity, pH/ORP, dissolved oxygen)!
1) Have You Ever Tested the Sensors in Blackwater (High Dissolved Organic Carbon Concentrations)?
So that we are all on the same page, blackwater as it is used here refers to water that has so much dissolved organic carbon (DOC), and particularly chromophoric dissolved organic matter (CDOM), that the water appears to be very darkly stained, like a very dark tea. This is not the same blackwater as the term is used in the wastewater industry, which refers essentially to raw sewage. As my colleague Kerry Hubbard points out in her Turbidity webinar (part of the How Sensors Work series), blackwater in the DOC-rich-environmental sense is not necessarily turbid, either. Some rivers appear black because they flow through very dark soils that become suspended in the water. That type of particulate blackening is not encompassed by the term blackwater. Water can be deeply colored due to dissolved organics yet not have many particulates (the source of turbidity) at all.
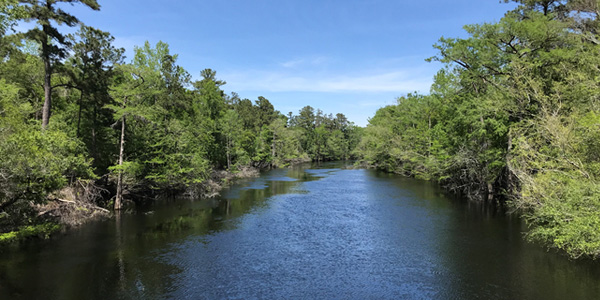
Blackwater Image Credit: Ben Thepaut, USGS. Gage station 02110550: Waccamaw River above Conway, SC
While you noodle on that point, the short answer to this question is no, we have not conducted a formal evaluation of how the sensors behave in blackwater. However, customers have approached me to discuss cases where highly colored water appeared to have been a source of interference. In those cases it further seemed that the chlorophyll channel was affected, rather than either the phycocyanin (PC) or the phycoerythrin (PE) channel.
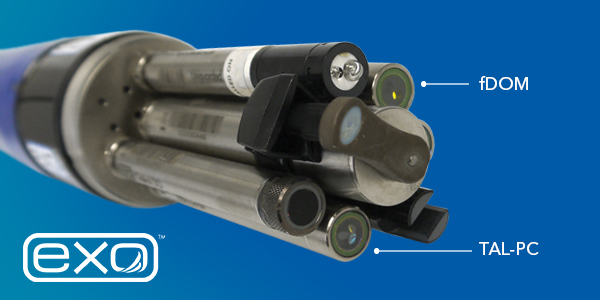
I wouldn’t blame you for being uncomfortable with words like “appeared” and “seemed” in that answer, so be aware that there are a number of approaches that can be taken to assess the possibility of this type of interference. For example, one can collect water samples to assess them for DOC or CDOM via spectrophotometric or other laboratory analyses, while at the same time testing them with the TAL sensor and looking under the microscope for actual algae. Some users are evaluating whether our fDOM sensor, placed on the same sonde with the TAL sensor, might give them clues as to possible interference. Relationships among these different measurements (fDOM RFU vs. RFU on the chlorophyll channel) can help you to understand if this is a risk for your monitoring scenario and if so, how you might address it in post-processing of your data.
Note that the relationships established at one site, such as fDOM RFU vs. RFU on the chlorophyll channel, will likely be different from site to site. Any relationship between TAL sensor output and fDOM, CDOM, TOC, DOC, etc. will depend upon the composition the organics. Are they able to absorb the wavelengths of light that are either emitted by the TAL sensor’s LEDs, or that might be emitted by algal pigments before those emissions can reach the sensor’s detector? How consistent are they from season to season?
For example, one astute webinar listener commented that the excitation LED for the EXO chlorophyll channel is 470±15 nm, which is very close to the wavelengths used in CDOM analyses. Thus CDOM-rich waters could be absorbing light emitted by the chlorophyll LED. The question then becomes whether those absorbing compounds emit light in the algae sensor’s range of detection (685±20 nm). If they do, the outcome could be an erroneously high signal from the chlorophyll channel in CDOM-rich waters. If they don’t, the outcome could be an erroneously low detection, because the CDOM may rob the algae of some of the light their chlorophyll molecules would have absorbed. Of course, it could also be a wash—if there are enough algae around the CDOM interference might be negligible. This seems to be the case most often.
2) We See Higher Chlorophyll and Phycocyanin Values Near Reservoir Bottom Whenever Turbidity is Higher. Is This Turbidity Interference?
I really appreciated this question because it afforded the opportunity to bring up several considerations that all algae monitoring scientists need to be aware of. Of course, this would be easier to answer if we knew how high “higher” is, and also how high the turbidity is, but lacking that information actually gives us the chance to explore all the options.
First, we can’t rule out that there are actually algae contributing to both the chlorophyll and the turbidity. We don’t know how deep the water is in this case, but be reminded that there are benthic algae in many reservoirs, and further there are microalgae (like the cyanobacterium Microcystis aeruginosa) that migrate in the water column, presumably to avoid photobleaching by sticking around on the surface all day. Maybe there are actually algae in the area of the reservoir where these measurements are being taken? Is the pattern the same no matter the time of day or no matter where the TAL and turbidity sensors are reading?
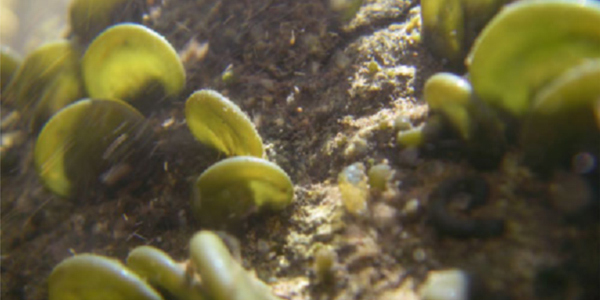
Nostoc sp. growing on rocky bottom substrate of the Yankee Fork of the Salmon River, central Idaho (Photo courtesy of J. Ryan Bellmore). Figure 9.1 from Cyanobacteria in Freshwater Benthis Environments.
Barring that, my first instinct would not be that chlorophyll would increase with higher turbidity, because turbidity more often would cause erroneously low values. In my 2018 webinar entitled “Are You Ready for Harmfuel Algal Bloom Season?” I talked about turbidity interference, using a very simple graph to show how it is most likely to affect TAL sensor readings:
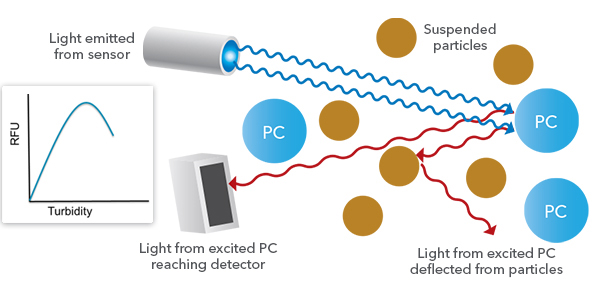
The particles that cause turbidity can deflect sensor-emitted light so that the light doesn’t reach the pigments, and the particles may also deflect light emitted by the pigments so that the light doesn’t reach the sensor’s photodetector. Thus turbidity interference is usually observed at that point where the RFU reported by the sensor will be lower than one would expect based upon the concentration of pigments in the water, due to particles blocking incidents or incoming light.
So if this listener can rule out that actual algae are the source of the turbidity and chlorophyll signals, and doesn’t seem to see classical turbidity interference, how then could the more turbid part of a reservoir contribute to erroneously high on the TAL sensor? I refer readers to my rather lengthy response to the blackwater question above. If the turbidity is in the midst of high fDOM, in particular, it is possible that the fDOM in that area of the reservoir is both excitable by the LEDs in the TAL sensor, and fluorescing in a wavelength range that is detectable by the TAL sensor. The higher turbidity is something of a red herring in this case; just because it’s higher doesn’t mean it has any effect whatsoever on what’s going on with the TAL sensor readings.
Thus there are a number of possibilities in this case, even beyond what I’ve outlined here, that can give this listener some avenues to explore.
3) How Similar are the TAL Sensors to Pulse-Amplitude Modulated (PAM) Fluorometers for Measuring Photosynthesis Efficiency?
My use of the word “pulse” in the webinar may be what conjured this question. I described how the different channels’ LEDs are on at different times so that the TAL sensors could distinguish when the detector was being tweaked by one pigment versus another (since there is only one photodetector in the sensor that works with both channels). In this manner there may be a bit of similarity to PAM; there are different light sources on at different times, so that what is detected during those periods can be compared. That seems to be where the similarity ends, though. The TAL sensors are using pigment-specific wavelengths of light, never use quenching light, and are not designed for any quantitative measurements of photosynthetic activity.
For readers seeking a more thorough answer, I had to do some serious Googling and find an actual book (imagine!), because I was not very familiar with PAM fluorometry. I came to learn (possibly re-learn, since it seems PAM would’ve come up back in my school days) that PAM is a procedure often employed by botanists and occasionally by phycologists. Its ultimate purpose is to evaluate the quantum yield of photosynthesis—the proportion of photons that will be funneled into the photochemistry of photosynthesis, rather than being lost as either heat or fluorescent light emitted by chlorophyll. This is achieved in essence by assessing the background fluorescence (F0) of dark-adapted cells and the maximal fluorescence they can emit (Fmax) when exposed to a saturating pulse of white light. Pulsing the cells with light that specifically activates Photosystem II (actinic light), where most photoconversion of light into biochemical energy takes place, teases out a momentary fluorescence yield that is somewhere between F0 and Fmax. That momentary fluorescence is indicative of the energy going through Photosystem II, and when corrected for background fluorescence and compared with Fmax one can calculate the effective quantum yield for the cells measured.
The hard-core photobiologists’ eyes are probably rolling into the back of their heads at my simplistic explanation, but I believe it suffices to answer the question at hand: the TAL sensors are not very similar to PAM, nor should they be, since the two technologies (PAM and TAL sensors) are designed for completely different purposes. The quantification of photosynthetic quantum yield is quite different than trying to get a relative population size assessment using algal pigment abundance in the water.
I really enjoyed researching this question and if readers want to learn more about PAM fluorometry I suggest starting with an oft-cited book chapter that explains the underlying principles, which still are relevant for modern instruments (Ulrich Schreiber, 2004, in Chlorophyll a Fluorescence: A Signature of Photosynthesis, pp. 279-319, eds. Papageorgiou and Govindjee, Springer). There is also a nice paper by Ogawa et al. that talks about the challenges and options for using PAM for estimating photosynthesis in cyanobacteria (Photosynth. Res., 2017, 133:63-73). Finally, the German company Walz, one of the main manufacturers of PAM technologies, has an excellent page of “PAM Application Notes” in addition to their latest “diving” PAM fluorometer.
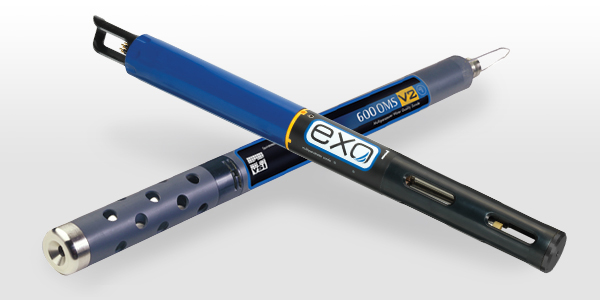
4) Can I Correlate my 600OMS PC Sensor to My Newer EXO PC Sensor? My Client is More Familiar with the Older (Larger) PC Values; Whereas the EXO Has Very Low Values (Decimals).
As this listener points out, 6-series users may notice differences in the readings they get with our old BGA-PC sensors versus the updated EXO TAL sensors. The 6-series and EXO sensors are fundamentally different technologies with respect to materials, components, construction, and very importantly, firmware. The Table below highlights some of the key differences when measuring PC with 6-series and EXO sensors, and which are the result of these technological differences.
|
Feature
|
6-series BGA-PC
|
EXO TAL-PC
|
Relevance
|
|
Excitation LEDs
|
Single orange LED for PC
|
Orange LED for PC, blue LED for Chl
|
Only need one EXO sensor for two pigments, saves money
|
|
Detection wavelength
|
640 ± 40 nm
|
685 ± 20 nm
|
Tighter bandwidths; less prone to interferences
|
|
Resolution
|
0.1 RFU;
0.1 µg/L PC |
0.01 RFU;
0.01 µg/L PC
|
10-fold improved sensitivity with EXO
|
|
Range
|
0-100 RFU;
0-280,000 cells/mL
|
0-100 RFU;
0-100 µg/L PC
|
Different scales because different power outputs of the LEDs are possible with EXO; eliminated the cells/mL unit with EXO so built into Kor 2.0 software
|
In spite of the inherent improvements in the EXO platform relative to the 6-series, scientists (including this listener’s client) can find it unsettling when there are subtle differences in how their data look when transitioning from one technology to another. I’ve experienced this myself in my years as a laboratorian, and environmental technologies seem even more prone to these differences. This is among the reasons that I often advise people to review environmental monitoring data for trends and patterns, rather than absolute values. (That’s a webinar topic in itself!)
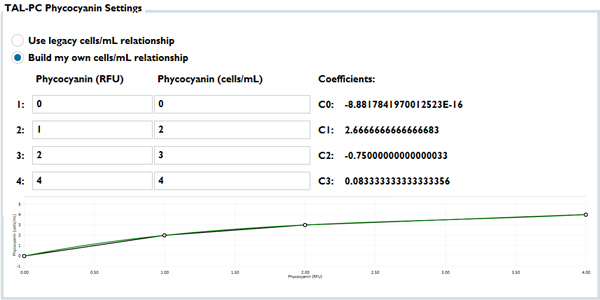
In 2018 we chose to address this issue by giving customers two new options in KorEXO software, within the calibration menus for the TAL sensors. First, many customers longed for the days of a cells/mL output on the PC channel, so they now have the freedom to build their own correlations between sensor RFU and cells/mL, so that the sonde can deliver cells/mL as an output for the PC channel. Second, at the same time we built in a data conversion that can make your EXO outputs look like 6-series PC outputs. The screen capture below shows this module from the software, where the “legacy” radio button is referring to an EXO-to-6-series data transformation, and line is just a goofy attempt to show how you can enter numbers into the correlation module:
This module allowed us at YSI to continue to strive for better practices in the industry, by which I mean continuing to encourage people to use RFU units and to treat in situ algae sensors as a monitoring tool, not as a laboratory-based analysis. Some of you have heard me evangelize use of the RFU unit, in fact even advising against the µg/L pigment units. I thought it was a very positive thing when YSI stepped away from cells/mL, and I advocate for us to do the same for the µg/L of PC unit in the future. Again, this 2018 webinar explains my bias.
At the same time, though, we could meet the very real needs of customers who, for whatever reasons, needed to use the cells/mL unit or needed their data to “look like” 6-series data. Thus, by using this module the listener that asked this question can draw the relationships needed to satisfy their client.

Additional Blog Posts of Interest
Answers to the Top 5 HAB Monitoring Questions
Red Tide Monitoring in the Gulf of Mexico | From Cells to Satellites
Are You Ready for Harmful Algal Blooms Season?
Harmful Algal Blooms | Everything You Need to Know