Red Tide Monitoring in the Gulf of Mexico | From Cells to Satellites
(Updated October 2021)
IN 2018, THE FLORIDA RED TIDE made global headlines, a 16-month ordeal that started around October 2017 and which didn’t subside until February 2019. Though Florida has experienced lengthier red tides, such as a 30-month event that started in 1994, the 2018 red tide gained broader public awareness thanks to social media and an information-hungry public that wanted to understand causes and possible solutions−and who expected The Sunshine State to take action.
The causes of red tides are contentious, forcing debate about the role of climate change and industries that contribute to red-tide-stimulating nutrient runoff. But almost everyone is in agreement that Florida must protect human health, its cherished marine animals, and its tourism-based economy.
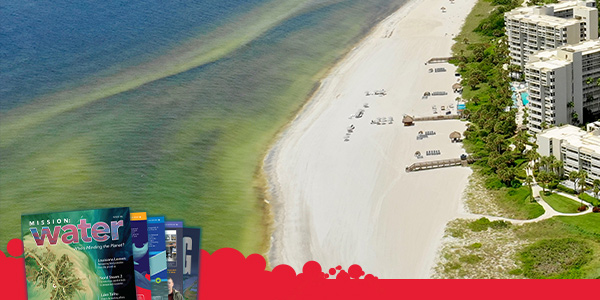
Florida’s coasts, and the resorts that fill them, were put under a health advisory during the Red Tide issue.
Human health is placed at risk in two main ways:
- Beachgoers exposed to toxin-laden aerosols can experience respiratory symptoms such as coughing, sneezing, itchy throat, or watery eyes, and the Florida Department of Health (FDH) advises that people with chronic respiratory diseases avoid beaches during a red tide.1
- Contaminated shellfish is another exposure risk, though a well-managed one since the shellfish industry is closely monitored by both the state and the Food and Drug Administration (but recreational clam-diggers beware!).
The impacts on wildlife, however, have been severe. The Florida Fish and Wildlife Conservation Commission (FWC) tracked over 200 manatee deaths2 confirmed or suspected to be caused by the red tide, and the National Oceanic and Atmospheric Administration (NOAA) has identified 149 dolphin “unusual mortality events” that may be attributed to the red tide.3

Red Tides impact life of all stripes along Florida’s cost line, ultimately costing the State millions in lost revenue.

There have also been countless fish kills, suspected bird mortalities, and sea turtle strandings and deaths.
Human health and ecological impacts notwithstanding, the commercial and political repercussions may have given the battle against red tides its most potent ammunition.
At the height of the red tide in August, 40 Pinellas County businesses claimed $128 million in lost revenue.4 Outgoing Florida Governor Rick Scott made millions of grant dollars available for the cleanup of dead fish,5 and within days of taking office in January 2019 Governor Ron DeSantis’ Executive Order created an Office of Environmental Accountability and Transparency within the Department of Environmental Protection. He has called for a “chief scientist” to oversee the investigation of both causes and mitigation strategies for red tides.
At this confluence of public health, ecological impacts, and policy are numerous monitoring programs relied upon by the public, policymakers, and scientists alike. Each of these audiences has different needs, and the three examples that follow demonstrate how those different interests can be served, as well as the evolution of monitoring approaches.
Cell Count
The question on the public’s mind is often “Is it safe to go to the beach?” Whether the answer is sought from the Florida Department of Health or the Centers for Disease Control, both will ultimately point your browser to the FWC’s Red Tide Status updates.6
The FWC publishes cell counts of Karenia brevis from over 100 sites along Florida’s beaches and posts them on a weekly basis (usually Fridays), or more frequently during severe events.

Red tides are a type of Harmful Algal Bloom caused by dinoflagellates like Karenia brevis.
Source: National Science Foundation
There is easy-to-understand information about how to interpret the cell counts, including a color-coded scale that ranges from “not present” (gray, for <1000 cells/L) to “high” (red, for >1,000,000 cells/L). In addition to their routine monitoring, FWC scientists respond to calls from other sites where a red tide is suspected. An easy way to follow this program is at their Facebook page, co-maintained with the Mote Marine Laboratory.

The FWC’s program of collecting water samples for cell enumeration with a microscope may seem old-fashioned to a molecularly-biased, high-tech-sensor-loving, post-millennial generation of scientists. However, microscopy remains highly valuable for a number of reasons. First, a skilled technician can rapidly and reproducibly count K. brevis samples (not true of all algae!), and the equipment is easily accessible and inexpensive.
Further, there are decades of cell count data available for comparison. Florida’s Harmful Algal Bloom (HAB) Monitoring Database is one of the longest, continually maintained datasets of any type, and shows that red tides have been documented in Florida as far back as 170 years. This continuity of data has been critical for demonstrating that red tides are not new to Florida, a sticky point when trying to assess red tides as natural events which at the same time can be fueled by human activity and climate change.
The microscope is slowly yielding to technologies that are faster, more sensitive and less prone to variability between technicians. The advantages of speed were realized years ago when technicians starting using Coulter counters, electronic particle counters not originally designed for this purpose, but which afforded not only speed but also highly accurate and reproducible counts, reducing subjectivity and technician-to-technician variability.

Traditional microscope technology is slowly giving way to modern advancements.
However, the Coulter is an agnostic technology, counting any electrically charged particle in the sample and offering no speciation. Thus counters were often used in conjunction with, rather than instead of, the microscope.
Exciting new technologies offer the best of all worlds: speed, high sensitivity, high accuracy, and speciation (even photos!), all possible via sorting based on the fluorescent properties of the algal cells. One of the best examples is the FlowCam by Fluid Imaging Technologies.7
With the FlowCam, and similar competing technologies that are now appearing on the market, much ado has been made about the comparability of the counts with microscope counts, due to the desire to maintain continuity in decades-old data sets.
However, a number of cases have shown that reproducibility from technician to technician is even difficult to ensure with the microscope, a realization that has probably eased the comfort people have with the FlowCam. The biggest barrier to its use appears to be expense, but the return on investment in technician time and reliable results seem to now be appreciated.

Water Quality
The next level of a monitoring program would incorporate water conditions that both promote and respond to K. brevis growth. Water quality monitoring potentially provides predictive capabilities as well as data that scientists use to understand biotic and abiotic factors involved in the formation and decline of a red tide. This type of monitoring need not replace cell counts, and in fact is most powerful when used in conjunction with them.
The aims of a water quality monitoring program need to be defined when choosing both the parameters and the approach to measuring them (e.g. via spot sampling or continuously-deployed multiparameter sondes), but in almost all algae bloom cases temperature, salinity, pH, dissolved oxygen and chlorophyll are useful. The diagram that follows identifies common water quality parameters and why they might be of value for red tide monitoring.
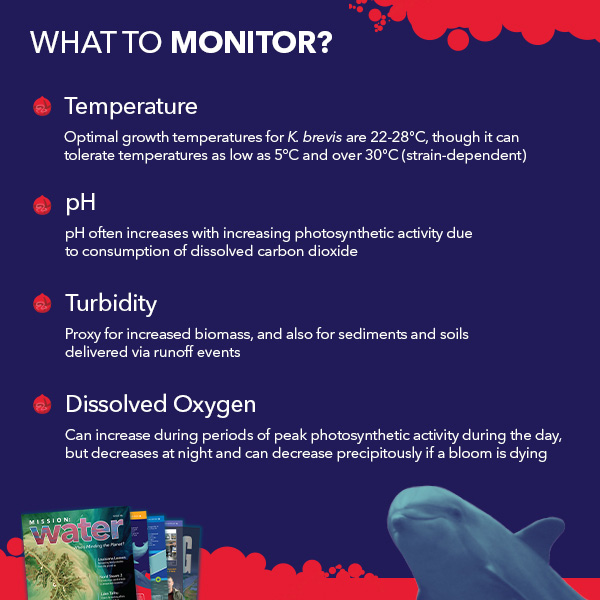
Federal agencies, Florida’s Watershed Management Districts and other state agencies, private research institutions, public universities and even citizen science groups deploy a number of technologies for water quality monitoring, including YSI’s EXO and legacy 6-series multiparameter sondes.
Pairing these technologies with data loggers and telemetry, the data can be made available for public consumption in near-real-time, and can also be used by researchers for incorporation into their own studies.
One such program is managed by the Ocean Research and Conservation Association, Inc. (ORCA). ORCA’s Kilroy Monitoring Network was in part supported by funding from the State of Florida until budget cuts in 2017, and the 501(C)(3) organization heavily relies on donations to keep its monitoring network, as well as a number of invaluable educational and volunteer programs, going strong.
Anyone can access ORCA’s water quality data, including historical data for the evaluation of trends and events at their monitoring sites.
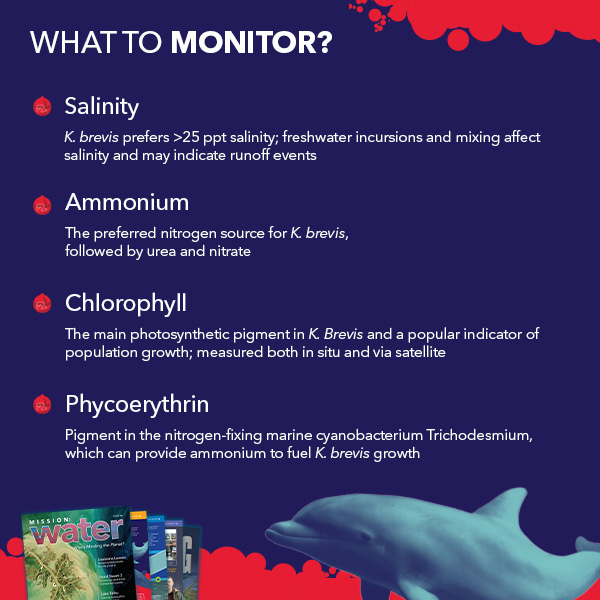
The consumers of ORCA’s data are usually scientists or educators, but one shouldn’t assume that the general public doesn’t care or understand what to make of a dissolved oxygen or a chlorophyll measurement.
Not only is public education clearly in ORCA’s mission, but having these data onboard in the context of ORCA’s other programs demonstrates to the public the importance of this type of monitoring not just for red tides, but also for conservation and protection of natural resources. People who care about the environment use this website and others to self-educate about red tides.

Satellites
Finally, those who favor a high-tech approach will surely want to check out satellite-based scans that detect fluorescence from chlorophyll on the surface of the water, as well as discolored waters that are indicative of runoff from heavy rainfall events.
These low-resolution but expansive snapshots from NASA’s MODIS and VIIRS satellites passing overhead provide a perspective on red tides that wasn’t possible to obtain until this millennium.

Research satellites like Aqua gather information about Earth's water systems using a suite of onboard instruments. Credit: NASA
NOAA has the most widely accessed satellite imaging program, and−for red tides in particular−one can subscribe to receive bulletins that are posted as often as twice-weekly during peak season.

These images are more than cool to look at. When integrated with cell counts, water quality, wind, and other meteorological information, the satellite data, and wind and other meteorological data, the satellite data form the foundation of fairly sophisticated forecasting models for not only red tides but also other types of algal blooms.
Forecasting is a key value of this program, and forecast subscribers cross the public and private sectors, scientists, and beachgoers alike. NOAA’s Harmful Algal BloomS Observing System (HABSOS) is an example of bringing all of that information together for “environmental managers, scientists, and the public.”8
The University of South Florida has a nice page that explains these technologies and which is probably a better site for scientists than the public.

An inconvenient limitation of satellite monitoring is that cloud cover can obscure the satellite’s view of the water. The satellite image (shown below) is from the July 12th HAB Bulletin for the Gulf of Mexico.9
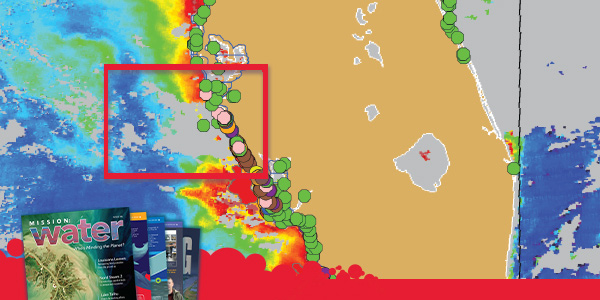
K. brevis Cell Concentrations Jul 02 - Jul 10, 2018. Credit: FWC Fish and Wildlife Research Institute and NASA
Technically called “ensemble imagery”,10 the dark red coloration along the west coast is indicative of heavy chlorophyll signals due to high concentrations of algae. The gray shading seen within the red rectangle is where “Recent ensemble imagery (MODIS Aqua, 7/10) is obscured by clouds along the coast from Manatee to southern Sarasota counties, preventing analysis of that region.”9
It is during these periods of high cloud obfuscation that it becomes apparent why the pairing of the satellite imagery with the cell count information is highly valuable. The cell counts must be relied upon for filling in the gaps created by the cloud cover.
Of course, cell counts can’t cover the wide geographical range that the satellites can, and that information paired with the wind and current data is important for understanding what may yet be coming to the shores of Florida (the forecasting value).
Another interesting thing to note is that sometimes the “hotspots” with the satellite imagery are speckled with green dots (meaning no Karenia is present in the cell count samples). This demonstrates another limitation of the satellite imagery: resolution. The spatial resolution for the satellite imagery is low, yet still highly valuable for understanding system-level patterns.
Red tides in the Gulf Coast of Florida. Credit: NASA
But for the beachgoer who wants to know where to swim in the near term, the cell counts and postings from public health officials are more valuable.
As NOAA continues to accumulate years’ worth of HAB bulletins and forecasts, while more local organizations compile water quality and cell count data along the shores, these data stores−and rapidly evolving "big data" computing approaches−will support more sophisticated modeling and forecasting. Thus from old to new, and cells to satellites, each of these technologies has a role to play in the ongoing battle with red tides.


1 | Florida Health, Red Tide Blooms
2 | FWC, 2018 Preliminary Red Tide Manatee Mortalities
3 | NOAA Fisheries, 2018-2019 Bottlenose Dolphin Unusual Mortality Event
4 | WTSP, Economic Impacts of Red Tide on Business in Pinellas County
Worse Than Expected
5 | WUSF, Sarasota Tourism Agency Survey Reveals Economic Impact of Red Tide
6 | FWC, Red Tide Current Status
7 | Fluid Imaging, Microalgae Research and Industrial Cultivation
8 | NOAA, Harmful Algal BloomS Observing System
9 | NOAA, Gulf of Mexico Harmful Algal Bloom Bulletin – July 12, 2018
10 | NOAA, Gulf of Mexico Harmful Algal Bloom Bulletin Guide
Additional Blog Posts of Interest
Are You Ready for Harmful Algal Bloom Season?
Answers to the Top 5 HAB Monitoring Questions
Under the Microscope | Q&A with Dr. Stephanie Smith
Monitoring for Harmful Algal Blooms: From Data to Decisions | Part 1 of 2