Kayaking the Mississippi River Solo to Measure Water Quality
The Mississippi River watershed covers more than 37% of the continental United States (2,981,076 km2). The river itself provides drinking water for over 18 million people and passes through 10 states. The source of the “Mighty Mississippi” begins as a meager creek in Lake Itasca, Minnesota, but the river grows as it flows, all the way to the Mississippi River delta in Louisiana and its final destination in the Gulf of Mexico.

Headwaters of the Mississippi River at Itasca State Park.
Alyssum’s Adventure
The expedition and study, Paddle On, was conducted to obtain a baseline analysis of Mississippi River water quality so that future studies can be compared against it. Alyssum Pohl (@AlyssumPohl), with a B.S. in Biology and M.A. in International Environmental Policy, solo kayaked the entire length of the river from source to sea documenting plastic waste and measuring water quality parameters - dissolved oxygen, specific conductance, total dissolved solids (TDS), and temperature - using a YSI Pro2030 handheld instrument.
I have focused my career on marine and coastal conservation, but I wanted to bring attention to the fact that the health of our oceans begins inland. I was shocked by the lack of baseline knowledge of the health of the largest river system in our country and realized I could tackle this project on my own. The project was funded via a crowd-sourcing Kickstarter campaign.
The Mississippi River runs approximately 2300 miles, and Pohl took the Atchafalaya (the “Old Mississippi River”) route to the Gulf of Mexico. Water quality measurements were taken approximately every 12 miles. Location was noted with a GPS unit. Water samples were tested from a kayak, at or near the center of the stream. The river varies from several feet wide and only a few inches deep to four miles wide and up to 200 feet deep.

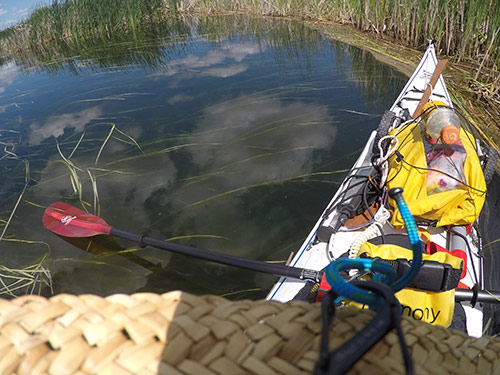
Pohl’s view during her trip down the Mississippi River.
Total Dissolved Solids and Specific Conductance Data
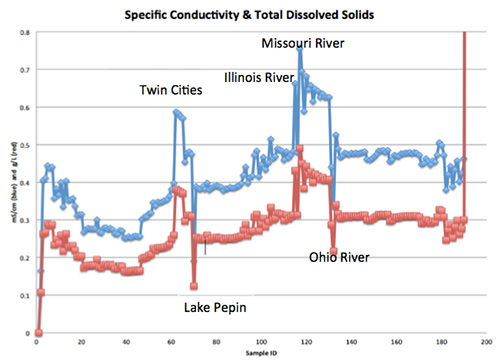
Graphs (Figure 1) for specific conductance (mS/cm) and total dissolved solids (TDS) (g/L) generally show the trend one would expect: at or near zero at the source and a huge spike upon reaching the Gulf of Mexico. At the confluence of fresh water with salt water, the specific conductance spiked to 8.42 mS/cm and TDS spiked to 5.47 g/L in the Gulf. There is a noticeable spike and drop (samples 62 and 70) which correspond with the Twin Cities, Minnesota, and Lake Pepin, respectively.
The spikes of samples 115 and 117 correspond with the confluence of the Illinois and Missouri Rivers, respectively, while the drop at sample 131 corresponds with the confluence of the Ohio River. Another factor that could alter these measurements include municipal discharge (salt from human waste, water softeners, detergents, and minerals could significantly increase conductivity).

Figure 1: Specific Conductance in mS/cm (blue) and Total Dissolved Solids (TDS) in g/L (red) data collected with the YSI Pro2030.
Dissolved Oxygen Data
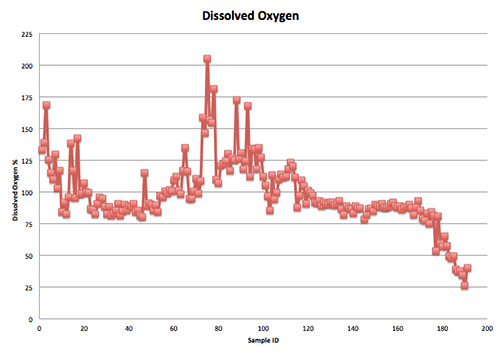
The largest peak in DO readings (Figure 2; sample 75) corresponds with a location just below Lake Pepin and the confluence of the Chippewa River. Overall, DO readings were between 75% and 125%, only dropping below 75% south of Vicksburg, Mississippi, which may have been due to changes in the river system (e.g. number of aquatic plants, temperature). The decrease in dissolved oxygen as the river nears the Gulf of Mexico is somewhat to be expected, because as the Mississippi River cuts through agricultural and urban areas, nutrients (particularly nitrogen and phosphorus) run off into the river.
Excess nutrients cause aquatic vegetation, specifically algae, to grow prolifically which leads to a condition called eutrophication. As algae die off, oxygen is consumed leading to low oxygen levels which makes it difficult for marine life to survive. In a “dead zone”, certain slow moving or attached aquatic organisms will perish without enough oxygen in the water. In 2015, the Gulf of Mexico dead zone was larger than normal, caused in part by heavy rains in the Mississippi River watershed.

Figure 2: Dissolved Oxygen (% saturation) data collected with the YSI Pro2030.
A Worthy Kayaking Companion
I was impressed with the reliability of the Pro2030. The YSI Pro2030 was strapped to the top of my kayak for over 4 months, enduring sun, rain, mud and more. The instrument was easy to use and impressively rugged - in comparison, 1 GPS unit, a camera, and 2 phones did not make it the length of the journey. The data collected with the Pro2030 provide a baseline understanding of the patterns of water quality conditions along the Mississippi River and will be shared with the Departments of Natural Resources of each of the 10 states through which the Mississippi River flows.

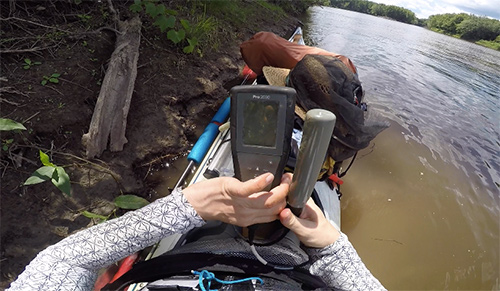
Pohl preparing to take Specific Conductance, TDS, and Dissolved Oxygen measurements with the YSI Pro2030.

Additional Blog Posts of Interest
What's the Difference Between the YSI Pro2030 and ProDSS ODO/CT?
Dissolved Oxygen Meters Q&A | The Ultimate List
Hypoxia, The Silent Killer You Need to Understand