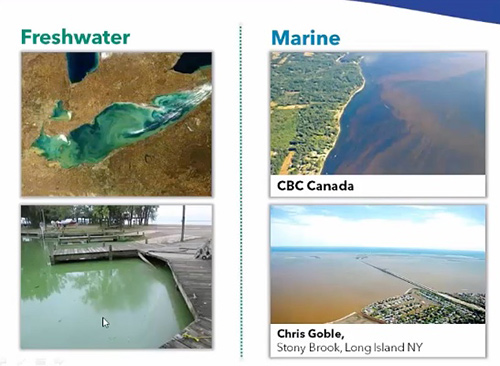
Stephanie: Thank you so much for that introduction, Brandon. And I'm very, very pleased to be talking to all of you today. And I want to thank you for your interest in this topic and in participating. And you are welcome to enter questions at any time. We want this to be an interactive dialogue. And we might stop in the middle of what we're doing to pick up some of those questions if we think they're going to be really useful for the wider audience. For the purposes of today's discussion, we're going to divide the world of harmful algal blooms into freshwater and marine because that's kind of how we do it in the field, and it helps us manage the scope of the conversation. I'm going to be talking mainly about freshwater harmful algal blooms that involve cyanobacteria today, such as you see here in Lake Erie from a NOAA satellite shot, and some pictures that I've taken myself.
The marine harmful algal blooms are definitely a huge area of concern and study. This bloom, this red tide in 2015 off the coast of Vancouver, British Columbia, and the northwestern part of the U.S. was probably the largest red tide on record. And then there are things like these brown tides that happened in Long Island, New York several years ago captured here by Chris Goble. We're not going to talk about those today. I would love to do that in the future though, if you think you'd like to hear more about that.
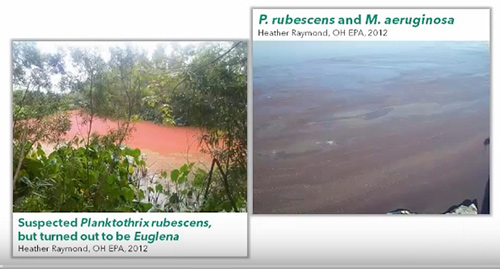
Moving on to talking about freshwater harmful algal blooms, a lot of us have some familiarity with this. And it usually seems pretty darn obvious when you see one. Here are examples of pictures I've taken of some freshwater blue-green algae blooms over the years. And the question I want to pose to you is, is it really always that obvious? We see some very interesting things, like this red bloom. You know, if this was a saltwater environment, you might have thought this was a red tide. But, in fact, this is a freshwater canal in my home state of Ohio that turned out to be an organism called Euglena. This is an organism that's actually not even a cyanobacterium, but this actually was a pretty nasty bloom. Sometimes we see things like this picture on the right with an organism called Planktothrix rubescens, and our favorite, Microcystis aeruginosa here in Ohio, and you get these kind of mixed and swirling looking blooms that look pretty distinct from the ones I showed you on this slide.
And sometimes, the water just looks kind of murky. This is, again, Planktothrix. It's a different species of Planktothrix. But the water looks kind of green and murky. This is a planktonic organism, hence its name. And planktonic means it really is floating around in the water column rather than forming that scummy bloom that we're typical...we're used to seeing with Microcystis aeruginosa. Likewise, for Cylindrospermopsis, Cylindrospermopsis blooms can actually be rather intense but it might not even be obvious to you immediately. Sometimes it just looks like muddy water.
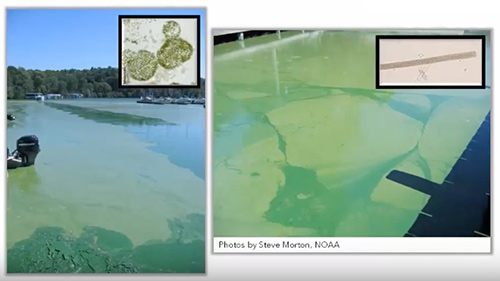
And here's another example that we see a lot on the great lakes. This is a picture taken in Michigan of these kind of round little filamentous balls you might not even realize are algae. This is an organism called Lyngbya. We see a lot of this on the shores of Lake Erie as well. And this is actually an organism that we now know can make some toxins. It's also an organism that we see cross over into the saltwater world. So it's not always so obvious what a harmful algal bloom is. And I kind of work through this phrasing backwards, a bloom is usually pretty obvious to everyone. It means an overgrowth of algae. But even the term algae is a little weird because when we're talking about cyanobacteria, or blue-green algae as we call them, they aren't true algae from the perspective of a biologist.
And then, the word "harmful" can even be a little bit dicey. Typically, when we talk about harmful algal blooms, the reason we care about them is because of the toxins that they often make. And many of you have probably seen a table like this before in the context of fresh water cyanobacterial blooms. These are the toxins we pay the most attention to, in the Midwest, at least. They certainly are not all the toxins that we know of or should be concerned about. There are lots of different toxins we see, especially in the south, along our southeastern coast. That Euglena bloom I showed you makes different toxins called Euglena Faison's. But these are what we see most commonly, and the organisms that we most commonly see making these toxins.
So you might notice Microcystis, who I've mentioned already, made the toxin microcysten and was the first organism where we discovered this toxin, but we've long since come to discover that these toxins can be made by a lot of different organisms other than the ones they were originally named for. So Cylindrospermopsin, originally found in Cylindrospermopsis, is made by a lot of different cyanobacteria. And the targets for these toxins are different organ systems, and they have different actions. Some of them are very acute action. So Anatoxin, for example, used to be called "very fast death factor" because of the very fast death that it would cause in a mouse model. Some of these are more chronic. You might be exposed to microcysten for years before you start to realize the effects of it.
But the question I have for you, and that Brandon is going to ask you, is whether the toxins are all that matters. So for example, here on the left, I'm showing you another bloom of Microcystis aeruginosa. This one shut down a regatta event. And here on the right I'm showing you a bloom of an organism called Oscillatoria, and this is not making any toxin. So, Brandon, let's see what folks think about these two blooms.
Brandon: All right, everyone. Hopefully, on your screen right now you can see a poll. I've launched it officially. And we're hoping that you guys in the audience can tell us. On that last slide, was the left image a harmful algal bloom? The right image, both or neither? And I'll wait just a little bit for you guys to vote. And it looks like we have about a third of the audience so far that's participated. So if you haven't put your vote in, go ahead and put your answer right in there on the screen. And we will summarize the results in just a second. Looks like we have about two-thirds of the folks who voted. Five more seconds guys and I'll pass it right back over to Stephanie for some analysis. All right, closing the poll now. And here are our results. So we have 35% of the audience thinks the left image is a harmful algal bloom because of the toxins, I'd imagine. Two of the folks in the audience thought the right would be a harmful algal bloom. And half the folks think both are. So, Stephanie, what's the answer to that?
Stephanie: The good news is there isn't really a wrong answer to this because a lot of this is in the eye of the beholder. But I would tend to agree with about half of our audience who say that both of these are harmful algal blooms. We often think it's just because of the toxins that something is harmful, but there are actually a lot of effects. Here's another example of...this is actually a Microcystis aeruginosa bloom, so that same organism that I showed you in the last slide. In this case, Microcystis decided not to make any toxins this day. But it would be hard to look at that and say it's not a harmful algal bloom. So what do we really mean by the term "harmful?"
Here's one example that many of us have experienced quite unfortunately, and that's a fish kill. A lot of people think these fish are dying because of exposure to those toxins. And certainly, in some marine harmful algal blooms, that's the case. But in freshwater blooms, often what kills these fish are anoxic conditions that are caused by the harmful algal bloom. So when we talk about harmful, the impacts can be about a lot more than just animal and human health. It can also be about causing adverse ecological impacts. Anoxic conditions that kill fish is a great example of that. The other one, that if you manage a drinking water facility, what makes your phone ring off the hook is when the water tastes funny. So a lot of these harmful algal blooms also produce these taste and odor compounds. I've given you a picture of a couple of them here, Geosmin and MIB. But I'll tell you what really put this issue on the map. A lot of it had to do with the economic damage that's caused by harmful algal blooms.
If you're at a lake like this, or a lake like this, not a lot of people are going to want to be using that marina or going to want to use that lake or go fishing that day. They're not going to want to eat at that Lake Shore restaurant because the smell from this can be really terrible. So these are other impacts that really start kind of diffusing out into society in a much broader fashion. So the question about this is, what are we going to do about it? And I don't mean that in the treatment sense, but I mean that in the monitoring sense.
Here's an example. I'm going to pause for just a second to let you kind of look at this quote that's on your screen.
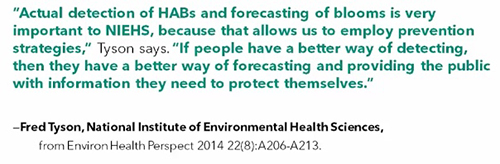
So Mr. Tyson is making the point here of how important it is to have a better way to detect blooms because if we get out in front of it early enough, you have more opportunity to do something about these blooms if you're in a system or a scenario where they might be treatable. But it's also a matter of warning the public, "Hey, maybe we shouldn't swim on this beach." And in our state of Ohio, our Ohio EPA does that a lot, up on Lake Erie in particular. So what exactly are you going to detect, though? If you want to do that early warning type of approach, what is it that you want to be monitoring for?
To answer that question, it might be helpful to remind ourselves or learn a little bit about some of the things that are both causes and effects of harmful algal blooms. And I break those bloom conditions out into weather or meteorological conditions as well as water quality. So looking first at weather, I think most of us have some sense that these are photosynthetic organisms which means they require sunlight or photosynthetically active radiation as we sometimes call it, and carbon dioxide, CO2, to grow. The gas dissolves into the water is bicarbonate, which will have an interesting impact on water quality that we'll talk about in a few minutes. But in terms of weather conditions, for instance, low winds can be an issue that favors the formation of a harmful algal bloom because there would be no mixing of the water. Sometimes mixing of the water really helps to aerate the water. And those less stagnant conditions make it harder for those scum forming algae and some of those other algae to bloom up.
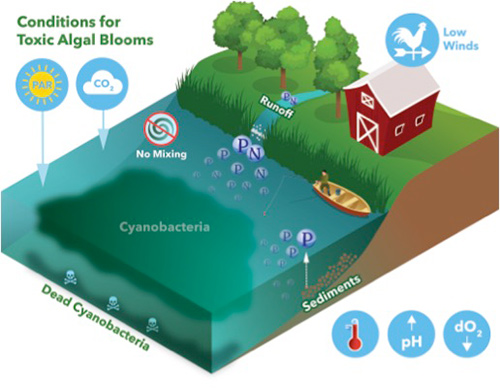
Other conditions that are important that aren't shown is obviously here are rainfall, for example. Rainfall can lead to these runoff events that introduce nutrients into the water. The nutrients we pay the most attention to, and when I say nutrients, I mean nutrients for the cyanobacteria, things that they eat, phosphorus and nitrogen are the ones that are key, with phosphorus being the one we generally pay the most attention to in freshwater blooms. Though I will say, Han's pearls lab in North Carolina has really shown that nitrogen can be quite important as well.
But those runoff events, we often blame that on runoff of fertilizer, agricultural fertilizer that's used on these fields. But I want to remind everybody that runoff is not the only source of those nutrients. A lot of these older lakes especially have phosphorous that's bound in their sediments. And in systems where a lot of runoff has occurred for years, that phosphorous, that sediment-bound phosphorus is also a nutrient source for cyanobacteria. Normally, there's not enough of these nutrients in the water for the cyanobacteria to bloom like this. But when you have a large introduction of them, the water becomes what we call eutrophic, and that really favors the growth of cyanobacteria. Lastly, in terms of weather, we all know that when it's warm is when we're most likely to see these cyanobacteria blooms, especially in the temperate climates like we live in here in Ohio.
So there are meteorological conditions that could give you a little bit of an advantage in understanding them. If you're monitoring these things and you start to see changes that might favor a harmful algal bloom, you know to be on the lookout. Rainfall is important not while it's happening, but really after it's happened. So for instance this past weekend, we had a lot of rain in this area. And guess what? This week, we're starting to see a bloom crop up in the western basin of Lake Erie, and I'm going to show you a picture of that later.
The other conditions that I like to talk about are the water quality conditions. So for example, I mentioned that carbon dioxide dissolves into the water, that sets up an equilibrium with something called bicarbonate. And as the cyanobacteria start to consume that carbon source, the pH of the water tends to increase. In fact, for a lot of drinking water managers, monitoring pH is how they know a bloom is coming on because that pH can get as high as 9 or 10 in the real throes of a bloom. But if you start seeing that pH creep up, that's a good sign that something is changing there that might be related to the algal populations. (Download a copy of The pH Handbook: a practical guide to pH measurement).
The other thing that happens that I mentioned briefly related to the fish is that dissolved oxygen concentrations can greatly decrease. Part of the reason that happens is because this bloom has a life cycle. A lot of these algae die. They sink to the bottom of that lake, and then there are organisms down here called Heterotrophs that actually use those algae as food. Those Heterotrophs are consuming oxygen in that process. So a lot of times these lakes become really anoxic. This is the kind of stuff that leads to the dead zone, in a gulf, for example. Anoxia is a huge problem for our natural waterways. In a lot of situations, algae blooms play a role in that. (Download a copy of The Dissolved Oxygen Handbook: a practical guide to dissolved oxygen measurements).
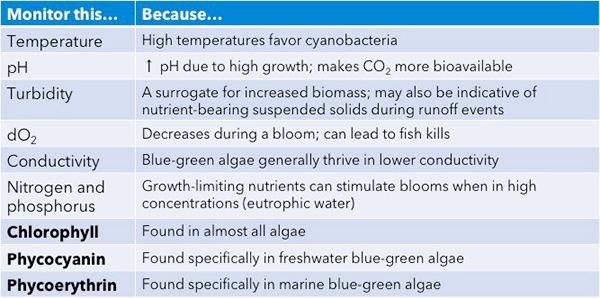
So what that means is there are a number of water quality parameters, including the temperature of the water, and I didn't talk much about turbidity, but these are all things that can help you understand the conditions and whether or not they're favorable for a bloom and whether or not they might be the consequence of a bloom. Three water quality parameters we're going to talk about a lot for the rest of this presentation are these photosynthetic pigments that are found in blue-green algae: chlorophyll, phycocyanin, and phycoerythrin.
So to summarize this upfront section, I hope it's clear that it isn't always easy to see a harmful algal bloom. And a lot of times, by the time you can see, it might be too late to do anything about it, and that not all blooms look alike. You could have one and not even really realize it. And just because it looks like a heavy bloom doesn't mean that it's necessarily making toxins. So early detection is really the optimal thing if you're managing a water body. And the best approach to detection is to monitor a suite of meteorological and water quality parameters. But the most widely used monitoring tools leverage those pigments of algae as we're going to discuss. So I'm going to turn it over to Brandon because he has another question for you, guys.
Brandon: So now that we've talked about some of the parameters that we can monitor to track a harmful algal bloom, we want to get some input from the audience. Are you guys monitoring any of these pigments currently? So give me one second and you'll see the poll. And it should be on your screen now. So select as many that apply for your organization. What are you monitoring right now? And it doesn't necessarily matter what the method would be, just the parameter type. And we've got about half the audience that's voted so far. I'm going to give just a few more seconds here for folks to reply. And it looks like we have a pretty good results. I'm going to close this poll and share it with our audience. All right. So it looks like a healthy majority of the audience is doing some monitoring of Chlorophyll but not so much on the accessory pigments that you might find in cyanobacteria. So it looks like approximately a quarter of the audience is looking at phycocyanin, and about 10%, 9% or 10% or so are looking at phycoerythrin. A good deal of folks, though, on the call aren't looking at any of these items. So there's around a third...Oops, Stephanie, that aren't looking at pigments at all.
But Before we jump into the next section, I'd like to answer just a couple, have you answered just a couple of the questions that have come in from the audience. And there's some pretty good ones that relate to the parameters that we've already discussed with meteorological or weather effects, in general water quality. One of the questions comes from Jessica. And she asked, does an area with a high amount of animal waste, maybe from things like ducks or potentially an area that's more recreational that might have dog waste, would that encourage the growth of harmful algal blooms in any way?
Stephanie: Hi, Jessica. That's a really great question. And, in fact, last summer, I visited a park in Columbus Ohio called Schiller Park where this was exactly the problem they were having. That park is a very popular downtown park with exactly what you say here. A lot of ducks, also, everyone's favorite Canadian geese, and dogs. And, yes, all of that animal waste is very rich in Phosphorus and Nitrogen. And a lot of that in rain events was running off into that very very shallow, albeit very beautiful and ornate lake in that Park. And so these are definitely things that can be a factor. However, it's very hard to say, you know, how to control some of that.
The other thing that could be a factor in areas like that is, for example, lawn fertilizers. I carefully use the word factor there because it's very hard to tie cause and effect in these situations. But those things could definitely be things that could contribute to conditions that favor harmful algal blooms. Great question. Brandon, do you see some others here that we might want to look at?
Brandon: Absolutely. So tying off that question, really short follow-up, should we stop feeding the Ducks? Is that going to change anything?
Stephanie: So that's a good question. And to tell you the truth, yes, we should stop feeding ducks in parks. And quite frankly, there are a lot of reasons for that besides just harmful algal blooms. So it really can encourage ducks obviously to be in the area. They're obviously going to leave a lot of waste in the area. But there are also some solid ecological reasons that we might not want to keep feeding ducks in parks. But that might be beyond the scope of our conversation here today.
Brandon: All right. So we'll do one more question on the parameters that I think would be good for the wider audience to know. So Jose asks, you mentioned that there were Phosphorus, extra Phosphorous dissolved in the sediment, and that can sustain a harmful algal bloom. How exactly does that Phosphorous get trapped, and how could it sustain a bloom?
Stephanie: So that's actually a question that it could take a really long time to answer, but I'll hit some of the highlights for you here. You know, a lot of sediments in the bottom of really old lakes, sometimes we call those kettle lakes because of the shape of them, you know, a lot of those sediments are very Phosphorous-rich just naturally. And as the water chemistry changes, especially pH, you start releasing what's called bioavailable Phosphorus. So phosphorus has to be in some specific forms in order for organisms to be able to use it to grow. And the water chemistry can really contribute to release of some of that ancient phosphorus that's in the sediment.
The other thing, when I use the term sediment, sometimes I'm really referring to kind of organic material that has settled to the bottom of that lake, which is rich in all types of nutrients, not just phosphorus. And sometimes that material is being degraded by heterotrophic organisms. I already mentioned that that can impact the dissolved oxygen, but it also can impact the release of nutrients like phosphorus and nitrogen. This is one reason that in some systems, they try to use dredging as an approach to really try to cut back on the release of those nutrients into the water. And in some places that works, in some places it doesn't.
Brandon: All right. Well, thanks, Stephanie, for answering a couple of those questions that were specific to this part of the presentation. Those of you that have asked other questions that we haven't gotten to, remember there's still the Q&A, and we'll pull back from this list. So keep asking away. But let's hop into the next section, and I'll pass it back to you, Stephanie.
Stephanie: Let's talk a little bit about those pigments. And you'll have to forgive me because this is one of my favorite areas of study related to algae. But it's really important to understand these pigments, to understand how the tools work. And I mentioned earlier that, you know, these are obviously photosynthetic organisms, so are plants, but algae are a different type of photosynthetic organism that we often divide into macroalgae and microalgae, and those microalgae include a lot of things. The things associate with red tides are typically for example diatoms and dinoflagellates. But we're talking more today about cyanobacteria or the blue-green algae. And the point I want to make here is these organisms, some of which I'm showing here and that I've already mentioned, these are actually bacteria, which are very different in their behaviors from eukaryotic algae and from all of these other photosynthetic organisms.
One of the reasons that's important in the context of harmful algal blooms is that bacteria grow fast. So if we look for example at this graph, which is from Pearl and Paul of 2012, this is showing optimal growth for different organisms. And the only organism on here that's a blue-green algae is Microcystis aeruginosa. The rest of these are what we might call healthy algae in a lake. These are some common organisms that we see. And what you can see here is how this growth curve for Microcystis is really shifted towards these warm temperatures. And this is one reason that cyanobacteria really have a selective advantage in the summer. When those waters heat up, for example, Prorocentrum really starts to take in those warm temperatures. Skeletonema doesn't even love it. That creates a real opportunity for something like Microcystis to take over.
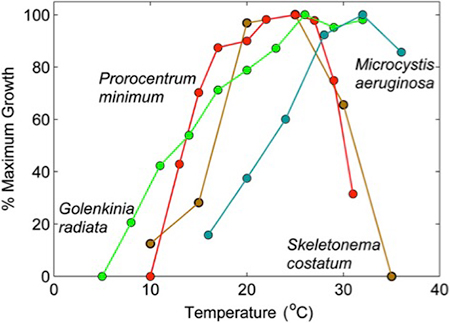
Cyanobacteria are bacteria, which means they grow faster than a lot of other microplankton.
The other reason it's important to realize these are bacteria is they have some unique pigments in what are called their thylakoids. So stay with me here while I try to explain a little bit what I mean by that. This is a Wikipedia image that some of you have probably seen before. And you have some awareness of chloroplasts in photosynthetic organisms. For those of us who like evolutionary biology, a cyanobacterium is a single-celled organism that practically is of chloroplast. And in both chloroplast and cyanobacteria, you have these folded membrane structures that are called thylakoids. That's where photosynthesis takes place.
And I know you all remember this from biology class. There's a thylakoid membrane, and this is all the apparatus of photosynthesis. Now, don't worry. I don't actually expect that you would remember any of this. But here are a few things that I want to remind you of, or teach you about in case you haven't heard of them. So you do know that photosynthesis, photo, starts with the light, from the sun. And that's what's meant by these squiggly lines. We're going to focus on this piece of the picture, which is sometimes called the light harvesting antennae of a cyanobacterium. And really there are three things to know.
In the center of that, we have the pigment called phycocyanin. Phycocyanin is in very close association with chlorophyll, which is actually embedded in those thylakoid membranes. And then in the case of a lot of marine cyanobacteria, you additionally have a pigment out here on the edge called phycoerithrin. These three pigments are absolutely critical in the photosynthesis. And as a reminder, what's going on here is the pigments are helping us to harvest that energy from the sun, and that energy is going to be used to make sugars, or to make the biomass that becomes the algae.
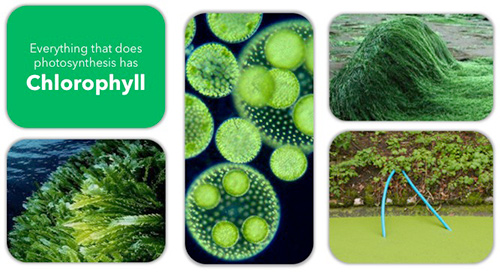
Here's why that matters. It matters because chlorophyll is found pretty much in everything that does photosynthesis. There are a few exceptions to that in the bacterial world. But basically, if it's green, it has chlorophyll if it's doing photosynthesis. But phycocyanin is found mainly, albeit not exclusively, in blue-green algae. So they have chlorophyll and phycocyanin just like I showed you. I'm not showing here that then some also have phycoerithrin.
And for decades, we've known, and we've used chlorophyll as a monitoring tool primarily by grabbing samples and measuring the content of chlorophyll in a laboratory. And generally speaking, if you have more chlorophyll, you have more algae. But more specifically, if you have a lot of chlorophyll and you have a lot of phycocyanin, you have more blue-green algae. And that really can help you to understand if you have some of those potentially toxic algae in your freshwater system.
So the way that works, the reason that works, is because these pigments are what we call fluorescent pigments. They directly absorb some of that light from the sun, and they also indirectly absorb some energy from the other pigments. And I'll talk a little bit more about that. That energy ultimately all gets funneled down to chlorophyll. And a lot of different things can happen with that energy that's absorbed. It can go on to do some destructive things. So believe it or not, algae can get too much light. And sometimes they have to...they either are going to die or they have to get away with it. But the vast majority of that energy that's absorbed simply gets released as waste heat. It's kind of like your air conditioner system in that regard. And then, of course, a lot of it goes to photosynthesis. But what you may not have thought about before is a lot of that energy also gets released as light by the pigments. So these pigments absorb sunlight, and then some of that light gets released as a different wavelength. And that's actually what fluorescence is.
So a fluorescent molecule is one that absorbs light, and sometimes we call that absorption excitation, and then the molecule will emit light of what's called a longer wavelength or a lower energy. So this is sometimes referred to as the visible part of the electromagnetic spectrum. Hopefully, you don't mind me going into a little bit of physical biology here. But you may remember that the UV, short wavelengths of light, these are the same wavelengths of light, for example, that can burn your skin. Those are the very high-energy. That's the high-energy end of the spectrum. And this is the low-energy end of the spectrum, the longer wavelengths. This is where infrared is, for example.
And that energy that was absorbed but didn't get released as light, it went somewhere else. It went to that waste heat or to photosynthesis. But those pigments have unique wavelengths at which they absorb or emit light. They don't all do this exactly the same way. So, for example, we look at that in the laboratory using a spectrophotometer or a fluorometer. So these are wavelengths of light that exists along that electromagnetic spectrum. And what you can see is that chlorophyll in the solvent methanol, for example, absorbs a lot of light, especially between 400 and 450 nanometers. And notice that this peak has a bandwidth. It's not perfect at one wavelength. It's across a width of wavelengths. It also absorbs a little light out here around 650 to 660. But that light that it emits, remember, has to be of a lower energy or a longer wavelength, and that's why its fluorescence or emission spectrum is out here closer to 680. You also get a little bump out here. That is sometimes called the EEM, the Excitation Emission spectrum for chlorophyll.
Phycocyanin, though, is quite different. Notice that phycocyanin is absorbing light way out here closer to 600 at its peak, and that it's absorbance is a really fat peak. It can absorb across a very broad range of wavelengths, but it emits at a slightly different wavelength. And I'm not showing it here, but the same can be said of phycoerithrin. It has a very characteristic absorption and emission spectrum. So when you put it all together, in those thylakoid membranes, those pigments are absorbing light both directly from the sunlight, and then they are emitting light via fluorescence. And some of that emitted light actually hits the sweet spot for another pigment to absorb.
And that is what we take advantage of in a lot of sensing technologies. We can identify specific pigments based on their absorption and emission spectra. Some of the peaks that are shown here are what we commonly use when we filter LED lights, for example, to hit these, in the lights that are put out by sensors or the lights that are detected by sensors. Chlorophyll can actually absorb some of the light that's going to be emitted by phycoerithrin and phycocyanin. That's why we call phycoerithrin and phycocyanin accessory pigments sometimes. Sensors measure that emitted light. And the big advantage of using fluorescence for detection is that it's super, super sensitive and it's very specific for the specific pigments. That's a huge advantage. Because usually sensitivity comes at the cost of specificity. So this is an advantage of using fluorescence, and it's really a reason that fluorescence is so widely used.
So these pigments are fundamental photosynthetic pigments. And looking at a suite of pigments rather than just chlorophyll or no pigments really can help you understand what types of organisms you may have present. Every one of those pigments is fluorescent and they have unique characteristics. And some of that light you get is fed to other pigments. So this forms the basis for really sensitive and specific monitoring tools and measurement tools that I'm going to talk about next. Brandon, do we have some questions to look at?
Brandon: Sure, we have one question, and then we'll jump into the next section. I think's very relevant to this. We have a question from Sochi. And he's asking, do the excitation and emission peaks on some of these pigments change with respect to whether or not you're in vivo or in vitro?
Stephanie: That is an excellent question. And the answer is yes. Some of these spectra can slightly shift depending on whether you're in vivo or in vitro. And for the rest of the audience, what he's referring to there is...So for example, chlorophyll, when it's bound in the membranes of those thylakoids, looks and acts a little differently than it does if you've extracted it with methanol and looked at it in the laboratory as I've shown you. And this is one of the...I don't even want to say downsides, but it's one of the considerations that we all need to be aware of, and it's also one of the reasons that I'm not a huge fan of using units like CFU, Colony Forming Units per mil, or even sometimes the pigment concentrations of micrograms per liter. Because how those pigments behave in water is often different than how they behave in solvents, and how they behave inside of a cell can be a little bit different than how they behave outside of the cell. So those are definitely factors. And it's one of the reasons that I really try to emphasize that when you're using fluorescence in this manner, you are doing monitoring. You are not doing hardcore pigment measurements. And that's a really important principle for people to understand. Thank you so much for asking that question.
Brandon: And we do have a couple other really good questions, Stephanie. But I think we'll save them for the Q&A session at the end. So let's go ahead and go forward with the next portion of the presentation.
Stephanie: That sounds great. I look forward to answering those questions. So let's talk about water quality monitoring and how, what some of the tools are that leverage those fluorescent product...those fluorescent properties I was talking about. So this slide is a beautiful picture that a friend of ours at YSI, Patrick Beatty made for me, capturing many different tools from really inexpensive but really handy handheld fluorometers that only measure chlorophyll or phycocyanin, to more sophisticated tools such as some of the multiparameter monitoring instruments that we sell at YSI, and even some of the bigger systems like fixed buoys with sonde or a vertical profiler, and even really sophisticated technologies that people like NOAA are using to monitor harmful algal blooms. Some of these are paired with satellites that can receive data from these different devices. And one thing that we still want to say, is very very important, is good old-fashioned sampling and pairing that up with lab analyses.
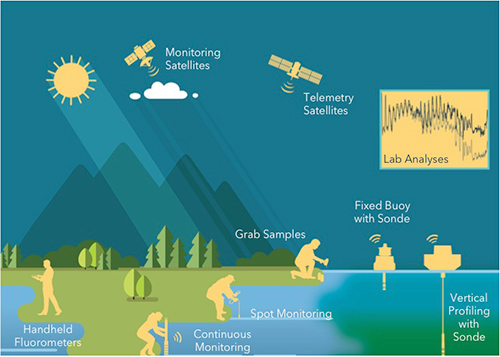
So let's look first at that because it really forms the foundation of a good program. These monitoring tools are all very powerful. But we really often have to ground truth our monitoring data with the old-fashioned way of collecting samples and doing your analysis in the lab. Now if you're trying to make decisions, management decisions, this is slow, and it's expensive, and you might not have time to do it. And that's why monitoring is so powerful and useful in...or in lake as we call it. But by doing grab samples and lab analysis, what you're really doing is measurements. And this kind of relates to Sochi's question that I just answered a few minutes ago. But when you pair grab sampling with monitoring, you really can reduce your material and labor costs because you can use that monitoring to help tell you when you need to do the measuring. And that's going to reduce the time that you have to, have people out in the field to do that work, or in the laboratory.
And a lot of those lab analyses, you know, this is, for example, showing a process for chlorophyll extraction. And there are always questions so I'm going to try to head them off right now. There are always questions about whether these types of analyses will correlate with what you get off of your Institute sensors. And the answer for that question is those correlations are very very strong in a laboratory setting. In the field sometimes, those correlations aren't as strong. And that's why I always say maintain your connection to these processes. Your monitoring tools will help you understand when it's most valuable to do this work. Some people are doing lab analyses directly, for example, for microcysten toxins. I want to make the point here that monitoring pigments is not always a perfect surrogate for whether or not Microcystis for example will be making toxins. And I showed you pictures of harmful algal blooms that would be really rich in pigment that don't have any toxin. So be careful of not falling into that trap.
And then the other lab analysis that's very popular now is doing enzyme-linked immunosorbent assays looking at the toxins. But keeping our focus on the pigments, I want to talk about the really powerful technology that's being used with satellites. NOAA is doing this a lot. This is basically a spectral analysis, looking at the pigments that are mainly on the surface of a lake. These are what are called MODIS sensors that are that are available on a couple of different satellites that, of course, the government has access to that you might not have access to. But fortunately, NOAA has made a lot of great data available to us, especially from the Gulf of Mexico and Lake Erie monitoring. And I would really encourage you, if you don't already, to subscribe to receive NOAA's HAB Bulletins. You can get them either for the Great Lakes region or for Lake Erie.
Here's my bulletin from last week that came to me for Lake Erie. And this was a really wonderful example because there's clearly a bloom starting up in Sandusky Bay and they did exactly what I was just talking about. They saw the bloom but people actually went out and collected samples to see what organisms and what toxins might be in that bloom. And it actually is a different, it's two different blooms. There's a bloom of plankton going on in the bay, and then there's a strong bloom of Microcystis, and there are, of course, kind of mixing in here. So it's really interesting to notice that you get these kinds of variations in the blooms.
But another thing that happened, I got my new bulletin yesterday in my email, and I got this. And this points out a few different things. Remember me mentioning that we had a lot of rain here in Ohio over the weekend. And the HAB landscape is starting to change now. So notice now that there's this nice, rich bloom popping up just like we know it does often when you get a lot of runoff into that lake introducing those nutrients. That bloom wasn't there just four days earlier. But now, the temperatures heating up, there's been a lot of nutrient influx. And I'm not saying those are necessarily the only causes, but that's definitely a correlation that we see this time of year.
But this graph shows us something else. Remember that bloom we were just talking about in Sandusky Bay, you can't even really see it here. And that doesn't mean it's not there. What you can see here is that there's a lot of cloud cover, and this is one of the downsides of satellite monitoring. That cloud cover actually blocks the ability of the satellite to see the surface of the water. And sometimes that's a limitation we have to live with.
So in terms of using those data to make decisions, most of us aren't on Lake Erie or not necessarily in the Gulf, and we're on a lake where we don't have satellite data. However, it's very useful to monitor what's going on in your region because it might be indicative of what could happen where you are. And these technologies, as far as public availability, are limited to the major bodies of water. I will point out, there are a couple of companies now that are starting to offer these types of data in a commercial fashion. There is occlusion from cloud cover and other things, like trees, or anything else that can get between that satellite and that surface of water. And these only use the pigments. They don't use any of those other water quality parameters that I talked about earlier in the webinar.
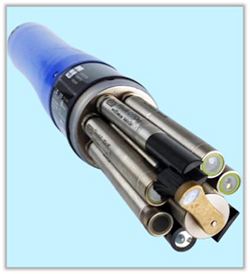 So what if you do want to take into consideration some of those other water quality parameters? Well, this is where we do get to talking about some of my favorite technology, which, of course, involves multi-parameter monitoring. And some of these other approaches that we're going to talk about leverage that technology. And this is just so that you're aware. An example of a multiparameter monitoring tool is, of course, a YSI EXO Sonde, which you can equip, for sensors, equipped with sensors that measure a lot of those water quality parameters we already talked about, as well as these critically important pigments. It has some other features that make it very useful, for example, for long-term and continuous monitoring. And it can even do some of the logging of the data for you just in case you're not one of the people who has a satellite, or access to a satellite.
But there is a critical question there. And that is, you know, what's most valuable for you to do using this type of multiparameter monitoring? Is it more valuable to you to do spot sampling, such as shown here, and using a platform like our ProDSS platform? Or is it more valuable to you to do a continuous monitoring deployment with something like an EXO2 Sonde that can even do telemetry.
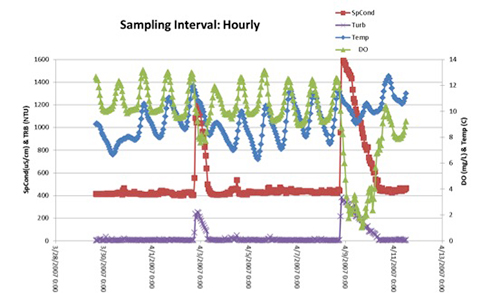
And one way to make the demonstration of the value of continuous monitoring, which is a lot more expensive to do, what are you getting when you pay for that? Here's an example of data that are collected in continuous fashion. And what I'm paying attention to over here on the right are the dissolved oxygen numbers, which is the green line in these graphs. So if you're doing spot sampling, let's say you're going out to your site once a week, and these are what your data look like. And if you calculated your average dissolved oxygen from those data, it might look like it's between 11 and a half and 12. But if you could sample more frequently, maybe you're one of those lucky people who has a graduate student that you're going to send out every day. And just getting that insight causes you to see a different average across that same exact period of time. And now you're actually seeing some activity in specific conductivity and turbidity, the purple line here. And you're seeing a real dip and dissolved oxygen that occurs right around the same time of that event.
Now if you could do monitoring hourly using a continuous platform, you actually get a lot of detail about a couple of events that there was no way you could see before. And that's the value of continuous monitoring. And it actually also could give you a very different understanding of your dissolved oxygen patterns. But that comes at a price. Those types of platforms are a lot more expensive than the spot sampling platforms.
Here's an example of their value, though. This, for example, is one of our test sites. I want to thank Tiffany Schirmer in our R&D group at YSI for giving me these data. Tiffany does a lot of our field work. And here she was collecting phycocyanin data, and she matched it up with some of those precipitation data that were also collected at the same site. So this is kind of matching up that weather data with your water quality data to see if you see any patterns. Sometimes you do, sometimes you don't. It definitely looks like she started to see an increase in phycocyanin here. But notice that this axis here is not that deep. Typically, this would go up to something...it get as high as, say, 30 micrograms per liter. So we're seeing some phycocyanin activity.
But let's compare that from the exact same sonde and the exact same sensor where we're measuring chlorophyll. Look at the numbers we get for chlorophyll. So this is the exact same precipitation pattern, because it's off of the same set of data, but what I want you to notice is there's a lot more chlorophyll in these samples. So what does this really mean? Well, what it means is you've definitely got a lot more algae in this system during this very warm period. And this period, from about June 29th of 2016 through the middle of August of 2016. That's not surprising. That's when blooms and algae often grow. But is this a blue-green algae harmful algal bloom? It might be. You definitely got a spike in phycocyanin that personally I would see as a cause for concern. So what I would do then is when I started seeing this spikes, I'm going to start sampling, and I'm going to start measuring those toxins. I'm going to start measuring those pigments in the laboratory, and ground-truthing these data, and getting a really nice thorough understanding of bloom patterns at this site.
So that is the type of data that can help you make decisions. It could help to guide a program of sampling, as I just recommended these data could do. And if you pair it with those, some of those metrological data, it can help support decisions you might need to make for treatment of the water, or for putting a posting up. But there is always this question about how much data you need to make your decisions? And that boils down to deciding whether you need to do continuous monitoring, like I showed you, or whether you might be able to get by with more of a spot monitoring approach.
We have a good Facebook live event that I direct you to on our Facebook page where we talk about this very product...this very topic, but we talk about it in the context of deciding where there's something like the ProDSS platform spot monitoring is the right choice for you, versus the continuous monitoring platform of YSI EXP Sondes. But in any case, I also want to remind you that continuous can yield a lot, a lot of data. Imagine if you're collecting samples every 15 minutes for up to 90 days. And you can do that with a platform like EXO. That's a lot of data. And our next webinar, which we're going to send an announcement out about within the next couple of weeks, is going to be exactly about that topic. We are going to pair up with some friends of ours at Aquatic Informatics about how you might handle those very large data sets, and even pull in data from people like NOAA, and other people collecting water quality information.
So the one thing I didn't really get to talk a whole lot about that we'll quickly cover is, what if you're using some of these systems that also do telemetry. That is a very powerful way to combine multiparameter monitoring and get those data automatically downloaded. So there are satellites that can actually receive data from these systems, and then you can download those data on your laptop. There are fixed in floating, profiling systems. So for example, we have a lot of fixed buoys on Lake Erie. And then there are vertical profilers. YSI makes some very nice vertical profiling technologies that can be used for monitoring stuff in the water column.
Vertical profiling is really really important. Because Microcystis aeruginosa, for example, can float in water. It can float and sink because it can fill its gas vesicles, allowing it to do that. And in the interest of time, I'm going to go kind of rapidly through this slide. But the take-home message on this is that during, different times of day, so looking from 4:00 till noon the next day, you can look at the behavior of organisms. And this is a model that was built in 2013. That's a beautiful model. And it shows that around 8 meters of depths, only about 10% of Microcystis cells would actively be sinking, which makes sense. Because they're never going to get any sunlight if they sink much deeper than that. But late in the afternoon when they've been exposed to sunlight all day, at least half of them are starting to sink. And that's because they can get too much sunlight. And they might want to, you know, save themselves from some of those photo toxic effects. And then early in the morning, they're rising to the top to eat up that sunlight. And only about a third of them might be sinking at that time. So that is why vertical profiling can be such a powerful tool.
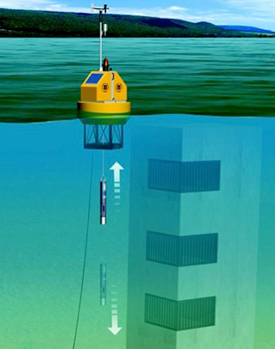 So for example, if you have a water intake with multiple levels, you can drop a sonde along a vertical profile and understand where is the highest density of algae in that water column. And you can use that to decide if you want to use one of these three different intakes in your water plant. So profiling allows you to get data where you want it and when you want it. And if you couple that with telemetry, you can get the data all the time, basically, which allows you to make really important decisions. But, again, it's a lot of data. And we'll talk in the future about how to manage some of that data, not just from that but from all of these approaches that you might take.
Here's the final summary. Just remembering that fluorescent pigments are the basis for all of these technologies that I discussed with you, but there are a lot of other water quality parameters that we might want to monitor. And we can combine those with telemetry to give you a lot of power in responding and reacting to harmful algal blooms, and in seeing them very very early on. I think we're going to go ahead and end there and start taking questions. But I'll just make you aware that I'm going to send you out some information about other harmful algal bloom webinars and resources that you might find useful. And we'll send those out with the slides to all the participants. And I want to thank you, guys, so much for your attention. And I will stay on as long as you want and try to answer questions.
Brandon: So really quick, everyone in the audience, before you hop off the call here, please answer the following question for us on how we should follow up with you after today's event. If you'd like more information on some of the technology that we've talked about, or maybe you'd like a personal consultation with one of our experts, let us know here. Try to answer this before you head on out. And for those of you that have asked questions today and are still waiting on some answers, we're going to spend as much time as we need, maybe another 15 minutes or so answering those. So if you have to jump off, no problem. But if you'd like to hang around and hear the answers to some of your questions, we're happy to hang on there with you. We do have a ton of questions, and they're really really good ones. So if you have time, I would say it's worth your while. But then again I'm the host of the webinar.
So it looks like most of the people have filled out the form. So I'll give you just a couple more seconds here. And by the way, once you leave, there is a post webinar survey. It'll just ask you on a scale of one to five, how did you enjoy the webinar today, and what content you'd like to see from YSI in the future. So if you could, fill that out, and hopefully we can put more educational content together that you'd be interested in seeing. All right, I'm going to close this poll. And then we're going to jump into a Question and Answer session.
But really quick, for those of you that are on the line here, we skipped through one slide that...Stephanie, if you could take me back to slides, I think is worth your guys while. And it's something that I'm passionate about that I don't want to slip by, which is "Mission: Water." And if you haven't heard about "Mission:Water," guys, it's a wonderful magazine that YSI puts together, and Xylem puts together that talks about all kinds of great work that researchers are doing around the globe. Follows the stories of researchers, folks in academia, the hard-working folks at places like Drinking Water Facilities as well. One of the things that bring this up for, reason I bring this up for his Stephanie, Stephanie Smith also has a wonderful Q&A in addition that comes out next week. So pay attention or look out in your inbox or on our social media sites for a link to that. It's a wonderful Q&A that you might get a lot out of. So anyways, that's my shameless plug for "Mission: Water" magazine. Hopefully you check that out next week. Now let's jump into the Q&A because you guys have got some great stuff. So, Stephanie, take it away.
Stephanie: Thank you. And boy, Brandon couldn't be more right. So I want to first address a comment that came in from Stephen that is a wonderful point. He says, "It should be clarified that sample pigment content or fluorescence magnitude does not have a simple relationship to algal or cyanobacterial biomass." He is absolutely right about that. And this is something that I am constantly preaching to the masses. Because people really like colony forming units per milliliter, for example, or grams per liter of biomass. And something to understand is that, in the course of photosynthesis...so for example, at one point in time, a cell might contain 10,000 molecules of chlorophyll. At another point in time, that same cell might contain only 10 molecules of chlorophyll. So you have the same number of cells but a very different amount of chlorophyll. And that's why I constantly remind people that these are monitoring tools. They are not measurement tools. So I think it's very...you have to be very cautious when you're trying to correlate some of these data. This monitoring guides, your science. But it shouldn't replace other tools that are kind of the foundation for how we study algal blooms. So, Stephen, I really appreciate you making that point. And you're spot on.
Q&A
Brandon: One great question that we have here, Stephanie, that I think ties well with the presentation and also how these technologies connect together is, we mentioned that a continuous monitoring device can trigger you to go take a grab sample, for Eliza, for example. Is there anything specific that you as a researcher would look at if you saw a data set and say, "Man, oh, right there. I need to take a sample now. And get out there, Mister grad student, or Miss grad student."
Stephanie: Thank you. That's a really great question. And, yes. So I look for what I would call sustained peaks. So, occasionally, if you're doing continuous monitoring, sometimes you'll see something really fly up there, and then almost just as fast it comes down. So it may be a real burst of activity maybe in just one day and the next day it comes down. If I don't see, you know, sort of a sustained behavior over a day, two days, three days, I don't get too excited about it. Now this is a personal preference, though. You might be working with a regulatory agency for example that requires you to act no matter what you see. So, yeah, I look for a sustained peak.
And the other the to remember is these are fluorescent sensors. And sometimes something else will trigger that sensor. And you don't know what that is. There might be light scattered, there might be some other event that for some reason you're getting reflection off a sediments, or something weird that could give you some of those more erroneous peaks. I will say the EXO sensors are far less prone to that type of background interference than the old Six Series sensors if some of you are familiar with those, and certainly some sensors made by other manufacturers.
The other thing I would say is this is where other water quality parameters are really important. If I start to see a peak in some of these pigments, I don't really see pH changing at all, I don't really see oxygen doing anything, I might not go out right away. The last thing I'll mention, though, is this is based on experience in the scope of systems I have worked with. I always tell people the most important time for continuous monitoring is your very first year. Because that's when you collect data and you start to understand patterns. So I would do a lot of sampling the very first year that you're using monitoring tools because then you're going to start to understand what the patterns are for your system. And what I'm used to, and what I've seen in some of these really small lakes here in Ohio that I've monitored for years might be a lot different than what you're going to see if you're up on the shore of Lake Erie or if you're in some of these very large systems. So that's a great question, and thanks very much.
Brandon, there's another question here that I want to get to, that Lucina has asked. And she says, "For grabbing samples, is there research showing whether, and if yes, how, phytoplankton deteriorate in a sample with time?" The answer is yes, and yes. There is research on this point. And the rate of deterioration, especially of the pigments, is very time-dependent and species-dependent of the phytoplankton. If you intend to grab a sample and take it to a lab for analysis, you need to put that sample on ice right away. And you need to get it to the lab, and either process it and then freeze the filters, for example, if you're doing chlorophyll extraction, or process it all the way through your process right away. There are a lot of caveats to that answer. It depends on the pigments, depends on the organisms, depends on even the time of day you take the sample. And it's why you have to establish reproducible sampling procedures to really get a good picture of what's going on in harmful algal bloom. Brandon, do you see any other good questions you'd like us to look at for now?
Brandon: There's a couple ones from earlier in the webinar that I think would be decent to talk about. One of which asks, what are the impact of trace metals on bloom formation? It sounds like a tough one. We may not have enough time for it. But it's a good question.
Stephanie: It's an excellent question. And, you know, I don't know all the answers related that question. But here's what I can tell you as a microbiologist. Trace metals are actually nutrients that are required by a lot of cyanobacteria. So some of those pigments and some of those photo centers and those light harvesting centers, they actually require specific metal ions as co-factors in the enzymes that are involved in that process. So if there's a shortage of those, it can be quite critical. And, in fact, diatoms in particular, can be stimulated by some of those, like, trace element mixtures I guess is what I would say. Now, I have to be honest. I am not up on all of the literature that has specifically looked at any of those correlations. I'm not up on the most recent literature on that topic. But it's definitely a very interesting one that we probably should look more into.
Brandon: Another question that's...I'll give you a softball question here, or a softer question, I should say. Still a good one. Can harmful algal blooms appear at deeper depths? And if so, what are their impacts?
Stephanie: That question, as you might imagine, depends on how deep you're talking about. So the answer is yes. They can appear at deeper depths. And a lot of it is very dependent upon the types of organisms and how well they can regulate their pigments. And it also depends on the quality of the water itself. So, for example, this is another reason that multi-parameter monitoring is so valuable. If that water is really really turbid, light isn't going to penetrate that water. So you might only really be able to get decent algal growth, you know, in the top 12 inches or less of that water. If that water is really really clear, very low or no turbidity, you can get algal blooms that are tens of meters deep. And we see that in some of our coastal and oceanic environments in those types of blooms. So you can definitely see them at different depths.
And the other thing I'll remind you of, especially in these, you know, what we call scum-forming blooms like Microcystis, those algae do die and they do sink. And they do still contain toxins when they're doing that. So sometimes what you might see at those deeper depths is sort of a population of algae that's starting to die. That doesn't mean you should ignore them. Because when they're dying, they might be...the cells might be breaking open and releasing some of those toxins. And those toxins will start to degrade in the environment. But there's definitely a little bit of a burst that can happen there. And that's been documented before. So that's actually...you may have thought it was a softball question, but it's actually a quite tricky question. There are a lot of aspects to it.
Brandon: Well, here's a softball question for it, and Stephanie, is there going to be an on-demand version of this recording afterwards? And absolutely there will be. And I know a number of you have requested to have a copy of Stephanie's slides. So we'll try to clean that up for you and send that out as well so the folks who have attended today as a gesture of goodwill. So, absolutely, we'll have all those sent out to you hopefully by the end of the week. We do only have about three minutes left in today's presentation so we'll only be able to answer about one more question. Those of you that are still in the line and haven't had your question answered, again, we'll shoot you an email with an answer. There's some of these that are particularly technical asking about specific equipment. So we'll save those for an email directly to you. And Stephanie, did you want to finish off with one final question?
Stephanie: You know, I do. There's one here that's a little unusual, and that's why I'd like to address. It comes from Gabriel in Quebec. And so, first of all, I want to thank our friends up north for joining us on the call. And we're really happy to have you here. And Gabriel says, "We are monitoring a lake in Quebec, and we observe that our concentration of blue-green algae are always higher during winter. Do you have an idea why?" I love this question because there are a number of reasons that they might be seeing that pattern. One of the probably primary reasons is there are cold adapted algae that thrive more in cold environments. In fact, I've seen algae blooms that have happened under ice. So that might be the population of algae that you have where you are looking.
But there's another effect here to be aware of, that everybody should be aware of that I didn't have time to talk about. And that is the relationship between fluorescence and temperature. The rule of thumb is the higher the temperature, the lower the fluorescence. And that's why you should always check to see if the data you are getting from your sensors are compensated for temperature. Even with that compensation, though, there can be more of a fluorescence effect just coming from the algae in cooler temperatures. So that's an interesting phenomenon that probably doesn't have a great impact on this particular scenario, but it is something that I want people to be aware of regarding fluorescence. And before someone asks it, yes, the sensors in the EXO platform, they are temperature compensated. So that's a great question, Gabriel, and thanks for joining us from up north.
Brandon: All right. So thanks, everyone, again, for participating in today's webinar. Just this one more reminder since we're still getting the questions. There will be an on-demand version of this recording that will be sent out. You'll get it in an email. And you'll also have a copy of the presentation once we clean that up as well. Just one more thank you to Dr. Smith for spending an hour or so with us today. Really appreciate it. As you guys can tell, we are so excited at YSI to have Dr. Smith on our team. And we're happy to have her onboard here. So anyways, thanks guys for participating in today's webinar. And hopefully we'll see you soon.