5 Harmful Algal Bloom Monitoring Questions
(Updated September 2021)
Early detection is critical for the management and mitigation of harmful algal bloom (HAB) impacts. YSI’s total algae (TAL) sensors are a powerful tool for that purpose and are used by thousands of people around the world for early detection.
Before reading those questions, here's a brief primer on the TAL sensors. Available on both the digital sampling platform (ProDSS) and YSI's continuous monitoring platform (EXO), YSI has two TAL sensors, and each has two "channels". The TAL-PC sensor (ProDSS TAL PC sensor or EXO TAL PC sensor) is the most widely used and it has both a chlorophyll channel and a phycocyanin (PC) channel. The TAL-PE sensor (ProDSS TAL PE sensor or EXO TAL PE sensor) also has a chlorophyll channel but instead of PC it has a channel for detecting the marine cyanobacterial pigment phycoerythrin (PE). Readers might want to review the descriptions of these sensors, the channels, and the pigments they detect in the EXO User’s manual or the webinar, Are You Ready for Harmful Algal Bloom Season?.
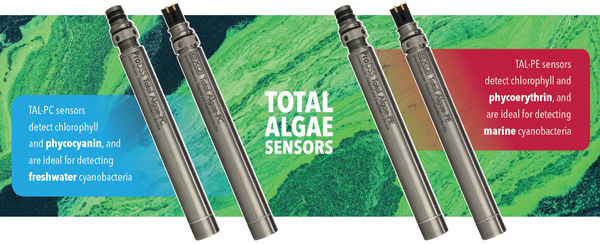
Whether you are a recent inductee into the TAL club or a seasoned veteran of HAB monitoring, please read on for Dr. Smith's take on these common questions.
Question #1: Which Sensor Works Best for Florida Red Tides?
Karenia brevis is the dinoflagellate responsible for the Florida red tide. I have encountered the misperception that the “red” is due to phycoerythrin, partly because in my webinars and other resources this pigment is often shown as a cartoonish red shape of some sort (and yes, it actually is red). 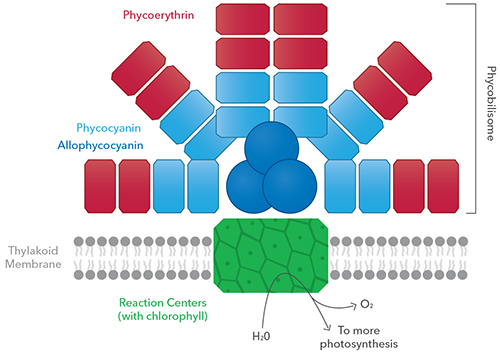
Further, since the Gulf of Mexico is a saltwater environment and the TAL-PE sensor is often called the saltwater algae sensor, it’s a short step to presume that the TAL-PE sensor is the right one for red tides.
In fact, K. brevis doesn’t contain phycoerythrin at all. Rather it has an impressive mix of different chlorophylls, carotenoids and accessory pigments, the complete assemblage of which yield the red tide organism’s physical appearance.1 Within that pigment assemblage is an abundance of chlorophyll, but neither PC nor PE. Thus, whether one uses the TAL-PE sensor or the TAL-PC sensor, it is the chlorophyll channel that is most telling of K. brevis growth.
With that said, I actually do have a preference for the TAL-PE sensor for K. brevis monitoring, as described below.
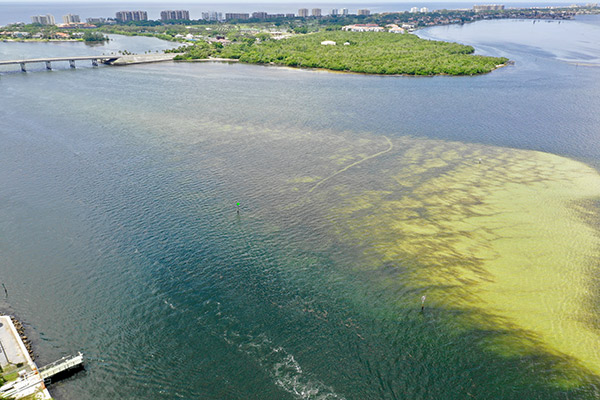
Aerial view of red tide along Florida's gulf coast - summer/fall 2018.
Question #2: Which Sensor Works Best for Monitoring in an Estuary?
This question gets asked because of the common statement that PC is found in freshwater cyanobacteria and PE is found in marine cyanobacteria. So what do you find in the algae where fresh and salt water mix?
Indeed freshwater cyanobacteria have high intracellular concentrations of PC and no PE. Marine cyanobacteria actually have both PC and PE, but very high concentrations of the latter relative to the former, making PE a better pigment for detecting marine cyanobacteria. Chlorophyll of course is found in all of these cyanobacteria.
However, estuary folk need to set these pigment points aside and think at a more systemic level.
In Monterey Bay many years ago microcystin toxin poisoning of sea otters occurred when the animals consumed filter-feeding shellfish which contained high concentrations of Microcystis aeruginosa. Normally a freshwater resident, M. aeruginosa was shown to have been delivered into the Bay from several rivers.2 A similar example of M. aeruginosa incursion into a brackish environment has been described for Puget Sound.3 In these cases, monitoring for M. aeruginosa would best be accomplished using the TAL-PC sensor, the “freshwater” sensor, even though it is in a salty environment.
Let’s return to the Gulf of Mexico, where a fascinating microbial community drives my preference for the TAL-PE sensor. Like many bloom-formers, K. brevis thrives when nitrogen and phosphorus become abundant since these nutrients are found in growth-limiting concentrations under healthy circumstances (healthy for the Gulf, that is).
Heil et al. published a summary of recently-described and previously-underappreciated sources of nitrogen, one of which is the marine cyanobacterium Trichodesmium.4 In 2004 Mulholland answered the question as to whether Trichodesmium could fuel a red tide, and showed that this cyanobacterium’s ability to fix atmospheric nitrogen into Karenia-accessible nitrogen is just one way in which Trichodesmium fuels a bloom.5 Even when Trichodesmium dies its decay releases usable nitrogen to keep the red tide going!6
Trichodesmium has a lot of PE, and the TAL-PE sensor would readily detect this cyanobacterium. It is for this reason that I prefer the TAL-PE sensor for red tide monitoring. Red tide watchers should weigh the value of this information, versus the interest in freshwater-cyanobacteria-delivering incursions into coastal environments when choosing whether to use the TAL-PE or the TAL-PC sensor.
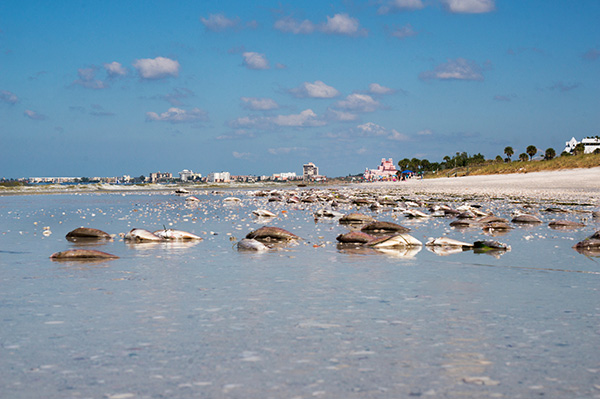
Dead fish litter a beach in St. Petersburg, Florida during the red tide event in 2018.
Question #3: Does the Chlorophyll Channel Pick Up Chlorophyll b?
I’ve been asked many times whether YSI’s TAL sensors detect the “other” chlorophylls (and there are at least 6 of these!), and there has particularly been interest in chlorophyll b. The answer is yes, but one needs to really think about whether it matters in the overall context of monitoring.
I suspect this question is asked because our manuals and application notes sometimes refer to the chlorophyll channel as a chlorophyll a sensor. That’s because the mindset at the time the sensors were developed was that they were for monitoring cyanobacterial HABs, and these algae contain chlorophyll a almost exclusively. Other chlorophylls are therefore erroneously perceived as causing interference with what the sensor is supposed to be detecting, that being chlorophyll a.
In actuality the TAL sensors are used much more broadly than just for cyanobacterial HAB monitoring, such as for K. brevis monitoring where chlorophyll c can be quite prevalent.7
Pigmentphiles can turn to a number of technical sources to learn about the absorption and emission spectra of fluorescent chlorophylls, and will learn that the wavelengths absorbed best by the different chlorophyll types varies a bit but that chlorophylls a, b, and c absorb vigorously in the 400-500 nm range.8
YSI’s chlorophyll channel LED emits blue light of 470 ± 15 nm. Thus, chlorophylls a, b, and c can readily absorb light emitted by the sensor, and each pigment’s emission spectrum is likewise similar enough as to be picked up by the sensor’s photodetector.
However, rather than being a problem for algae monitoring it is a benefit. The TAL sensors were designed for exquisite sensitivity and were never intended to be a fluorometric tool for pigment speciation. Early detection is key in HAB monitoring.
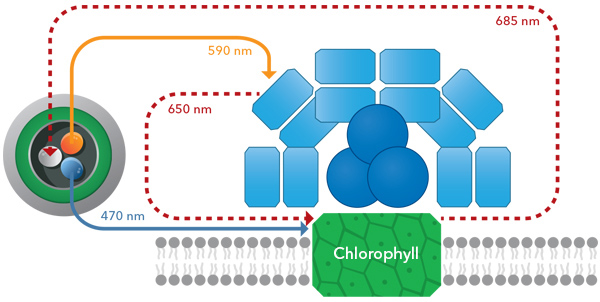
Chlorophyll absorbs blue light from the TAL sensor which is then able to read wavelengths of excitation light from the molecules.
Watch the Webinar: Drowning in Data, Monitoring Harmful Algal Blooms
Question #4: Why Don’t My Lab Chlorophyll Extraction Data Match Up with the Chlorophyll Numbers from the Sonde?
Hindsight being what it is, I wish that we and other vendors had never used cells/mL or µg/L of pigment as units of measurement on our platforms. We did it because customers wanted these units (and still do), because for many decades cell counts and solvent-based chlorophyll extractions were the primary tools for assessing algae abundance in the environment. Thus most people have an inherent trust in chlorophyll concentration expressed in µg/L, and this unit of measurement provides a convenient frame of reference for comparing today’s data with historical data collected before we had sensors.
But these units have really ignited the misperception that one is measuring pigment concentrations with the sensors in a highly accurate or precise manner. It is important to understand that the correlation between the sensor’s mV signals and µg/L delivered by the sensors was built using one species of algae which were grown in a laboratory under highly controlled conditions that included a never-changing light intensity and duty cycle. Thus one should not expect that all algae, under all conditions, would yield the same correlation.
With that said our correlation holds up surprisingly well in most bloom situations, and in our manual, we describe how you can ground-truth the µg/L unit for your monitoring scenario. Many users can get highly reliable µg/L outputs, and of course “reliable” is in the eye of the beholder.
Where the correlation erodes most is at pigment concentrations so low that even lab-based extractions are not reliable measurements of µg/L. Certainly the mix of algae in the population and even the time of day at which a sample was taken also impact the reliability of the µg/L unit. If you are among the users whose algae blooms don’t behave in a way that makes µg/L a reliable unit, my advice is to use the TAL sensor’s relative fluorescence units (RFU).
In fact, that’s my advice to everybody. Learn which RFU thresholds matter in your system, how to use them for recognizing changes of relevance for bloom formation and life cycle, and relieve yourself of the burden of trying to get µg/L to line up with biased expectations for the reliability of chlorophyll extractions.
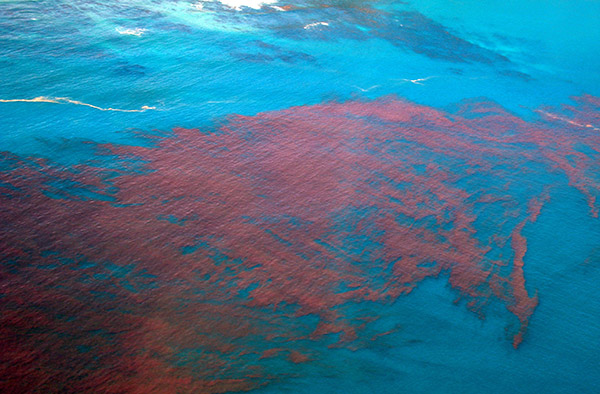
Algae bloom in the Atlantic Ocean - fall 2018.
Question #5: OK, I’ll use RFU. So at what RFU do I have a Bloom?
The unsatisfying answer to this question is that there isn’t a single answer. That’s because all systems have different meaningful thresholds and behaviors, and with ongoing use one will build an understanding of what matters for any specific site or system.
I always recommend that one starts algae monitoring in the “off season,” a geographically-dependent time of year when algae blooms are less probable if they even happen at all. This enables one to see what the background detection levels are in a system, and to identify when deviations from baselines start to occur. With ongoing years of use, highly relevant patterns will emerge.
Some YSI customers have gotten so good at recognizing these patterns that they know specifically what type of algae are blooming at different times of year because of things like the chlorophyll to phycocyanin ratios and their knowledge of seasonal preferences for certain species. Similarly, when they don’t see the usual patterns but do see deviations from their normal baselines, they may have unusual blooms. We saw this recently with a brown tide off the Atlantic coast of Florida.
In all cases, the sensors can’t tell you species of algae in the direct sense, but these patterns combined with other water quality indicators (especially pH and dissolved oxygen) and most importantly, experience and good data sets, are where the real power of the TAL sensors comes through. I hope all readers will be able to realize that potential in their algae monitoring applications.
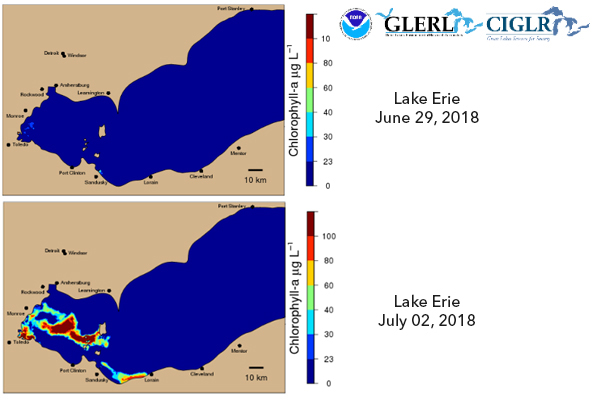
HABs tracked on Lake Erie at the start of bloom season.
Watch the Webinar: Red Tide Monitoring
1 Millie et al. 1997. Limnol. Oceanogr. 45:12410-1251.
2 Miller MA, Kudela RM, Mekebri A, Crane D, Oates SC, et al. (2010) Evidence for a Novel Marine Harmful Algal Bloom: Cyanotoxin (Microcystin) Transfer from Land to Sea Otters. PLOS ONE 5(9): e12576. https://doi.org/10.1371/journal.pone.0012576
3 Preece EP, Moore BC, Hardy FJ. Transfer of microcystin from freshwater lakes to Puget Sound, WA and toxin accumulation in marine mussels (Mytilus trossulus). Ecotoxicol Environ Saf. 2015 Dec;122:98-105. doi:10.1016/j.ecoenv.2015.07.013. Epub 2015 Jul 25. PubMed PMID: 26218554.
4 Cynthia A. Heil, L. Kellie Dixon, Emily Hall, Matthew Garrett, Jason M. Lenes, Judith M. O’Neil, Brianne M. Walsh, Deborah A. Bronk, Lynn Killberg-Thoreson, Gary L. Hitchcock, Kevin A. Meyer, Margaret R. Mulholland, Leo Procise, Gary J. Kirkpatrick, John J. Walsh, Robert W. Weisberg, Blooms of Karenia brevis (Davis) G. Hansen & Ø. Moestrup on the West Florida Shelf: Nutrient sources and potential management strategies based on a multi-year regional study, Harmful Algae,Volume 38,2014,Pages 127-140,ISSN 1568-9883,https://doi.org/10.1016/j.hal.2014.07.016.
5 Mulholland, M.R., Heil, C.A., Bronk, D.A., O’Neil, J.M., Bernhardt, P., 2004. Does nitrogen regeneration from the N2 fixing cyanobacteria Trichodesmium spp. fuel Karenia brevis blooms in the Gulf of Mexico? In: Steidinger, K.A., Landsberg, J.H., Tomas, C.R., Vargo, G.A. (Eds.), Harmful Algae 2002, Proceedings of the Xth International Conference on Harmful Algae. Florida Fish and Wildlife Conservation Commission, Florida Institute of Oceanography, and Intergovernmental Oceanographic Commission of UNESCO, St. Petersburg, FL, pp. 47–49..
6 Mulholland, M.R., Bernhardt, P.W., Ozmon, I., Procise, L.A., Garrett, M., O’Neil, J., Heil, C., Bronk, D.A., 2014. Contributions of N2 fixation to N inputs supporting Karenia brevis blooms in the Gulf of Mexico. Harmful Algae 38, 20–29.
7 Millie, D.F., Schofield, O.M., Kirkpatrick, G.J., Johnsen, G., Tester, P.A. and Vinyard, B.T., 1997. Detection of harmful algal blooms using photopigments and absorption signatures: A case study of the Florida red tide dinoflagellate, Gymnodinium breve. Limnology and oceanography, 42(5part2), pp.1240-1251.
8 Still one of the best references for photosynthetic pigments is Kingsley S. Rowan’s Photosynthetic Pigments of Algae, Cambridge University Press, 1989.