Improve Your Activated Sludge Process Efficiency in Three Steps
Video Transcription
Transcript by Speechpad
(This is a recording from a webinar hosted by Dr. Rob Smith)
So, optimization of the activated sludge process requires careful management of three critical parameters. Over the years, wastewater professionals have based their control decisions on measurements from batch tests supplied to various samples or from infrequent laboratory analysis. Those are measurements done on composite samples for compliance purposes. Today, besides talking about the three things you need to know, we're also going to offer you some alternatives for monitoring that can improve your ability to optimize the process.
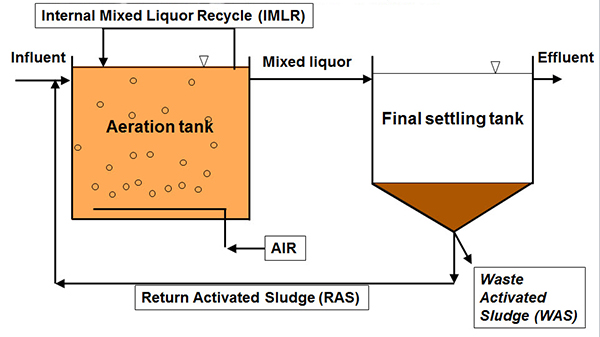
On the title slide here, we have a couple of pictures to get you in the mood for the talk. On the bottom left panel is an activated sludge system showing all three things we're going to talk about. And on the right side is an aeration tank from a local water resource recovery facility.
So, taking a look at this diagram, showing the basic elements of the process, the aeration tank, and the final settling tank, there are three things we can do to control this process between these elements.
1) One is the air, the aeration rate.
2) Another is sludge wasting through waste sludge.
3) And the third is sludge recirculation, either through return activated sludge and/or internal mixed liquor recycle for nutrient removal. We'll dive into each of these topics a little deeper as we move along.
But before we do, I want to introduce a little bit about one of the greatest inventions of the 20th century, that being the activated sludge process. It was spurred by rapid industrialization in the late 19th and early 20th century and had many beneficial effects, especially for public health. Although gentlemen named Ardern and Lockett are generally given credit with or invention of the process, due to their papers published in 1914. Its development was actually the culmination of years of research and discovery. Early on, researchers had discovered that aeration had beneficial effects for odor control but the treatment ability was less than needed.
Other researchers had discovered the growth of this humus, what they call it was humus, we might call this biological growth, did have some beneficial effects for removal of pollutants from wastewater. But what Ardern and Lockett had discovered was that by retaining the solids in the system and recycling them back into the aeration tank, the solids were said to be activated. And thus the main activated sludge came about. So, all configurations are based on this research and invention, and they all have certain things in common. They are biological, microbiological, they are all aerated, at some point in the process where the bacteria or the biology is suspended in the water. And hydraulic retention time does not equal solids retention time. That's a bit of an extension on the findings of Ardern and Lockett. And of course, requires specially trained personnel, like you folks tuned in today.
Step 1 - Aeration
Let's start with a discussion of aeration. Looking at this chart (below) here which is kind of a general relation of the ORP (oxidation reduction potential) on the horizontal axis, we can say that aeration controls the biochemical environment. So for instance, on the positive side of ORP is where we would have oxic conditions. On the negative side, somewhere on the negative side of ORP, we would classify as anaerobic conditions. And then in between is a region we call anoxic. And so depending on what you're trying to accomplish, each of these zones are important.
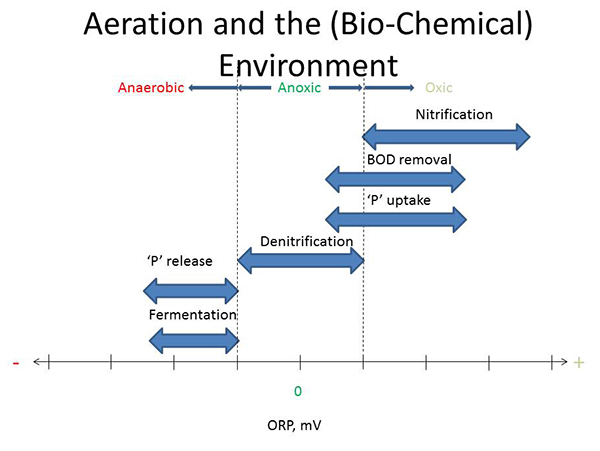
So nitrification, for instance, takes place exclusively within the oxic zone because the bacteria require dissolved oxygen (DO). Biological oxygen demand (BOD) removal, on the other hand, is done by a lot of microorganisms that can be active under an oxic condition as well as anoxic conditions. When we start talking about phosphorus removal, phosphorus uptake also could occur oxicly and anoxicly. But general understanding is denitrification is exclusively in the anoxic portion or anoxic region of this chart. Moving over to the anaerobic zone then, phosphorus release. Again the second part, important for biological phosphorus removal occurs in the anaerobic zone. And then fermentation, which is important for sludge treatment, but also for biological phosphorus removal, also occurs in this zone. So by managing aeration, you control the environment for the biology.
Looking at it a little more specifically, you take a look at this chart which shows reaction rate versus DO concentration. And for nitrification, it occurs as it relates to how that rate is related to dissolved oxygen. And it shows that from zero up to one, one and a half, 2 mg/L DO, an increase in DO concentration results in a proportional increase in the reaction rate. Beyond 2 mg/L, an increase in the DO concentration does not result in an appreciable increase in the reaction rate. And the number that we can maybe classify using this number which is the DO concentration at which nitrification rate is one-half of the maximum rate, which is 0.75 in this case.
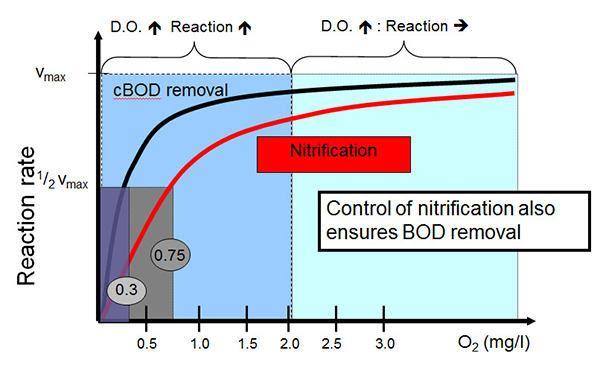
Effect of Dissolved Oxygen Concentration on Biological Treatment - Reaction Rate vs. DO
cBOD removal, the curve for that is shown here with the black line. And this function occurs with a maximum rate occurring at a DO concentration of 0.3 DO. And so taken together, these curves mean the control of nitrification also ensures BOD removal and establishes the basis for maintaining DO at or below a 2 mg/L set point. Diving in a little bit more with dissolved oxygen and performance relating to nitrification and denitrification, this chart shows again the max process rate on the vertical axis and the dissolved oxygen concentration on the horizontal axis. The blue line is the nitrification rate. Again it should look pretty familiar, it's very similar to the last chart. And so it increases with DO concentration.
But the magenta line which is the denitrification rate is new to this chart and it shows that a higher dissolved oxygen concentration actually reduces the denitrification rate. So by maintaining too high of a DO concentration, you can also compromise denitrification.
From an energy perspective then, other incentives for minimizing DO concentration are shown by this chart, which shows again the DO concentration on the horizontal axis, the cost on the vertical axis. On the left side a cost multiplier. So for instance, for the DO curve here in red at 2 mg/L, there will be no additional cost to provide that oxygen to maintain that 2 mg/L. So your multiplier is one.
But for instance, if we were to maintain DO at 4.5 mg/L instead, it would result in, relatively speaking, a one and a half times increase in cost to provide aeration for the activated sludge process. And in extreme cases, say for a DO concentration of eight, that cost is over four times as great as the cost it would be to maintain a DO of a concentration of two. So there are very significant impacts of not controlling dissolved oxygen. I did promise we would talk about dissolved oxygen measurement and ways to control the process, alternative ways to control the process. The method here, ASTM (ASTM D888-09 Test Method C), defines a means for measuring DO with an optical method. And it has a lot of advantages over the traditional membrane style polarographic dissolved oxygen measurement.
Very stable calibration, lower maintenance, there are no membranes to replace, no electrolyte to replenish, no sulfide interference, and very good accuracy. So these are all improvements over the polarographic style of measurement. On the right-hand panel then is an example of a continuous online dissolved oxygen sensor. See there is a light source on the inside that reacts with a fluorescence flare on the underside of this removable replaceable sensor cap. And that reaction establishes the relationship between a fluorescence, for example, and dissolved oxygen concentration. This sensor is digital such that the calibrating constants can be uploaded to the system through this chip built into the sensor cap.
Now for portable or benchtop applications, there are other benefits of optical DO. One of those is no stirring requirement and no warm-up requirement. So for DO spot sampling, for example, optical DO is just as applicable as it is for online process monitoring. ORP is another way, important measurement that you can use to help control aeration.
Some have referred to it as a negative DO sensor that's able to measure negative DO. But that aside, just looking at the technology itself, we've got two electrodes connected between the sample through a voltmeter and a reference electrode with a junction and a measuring electrode, an ISE, with a membrane. The difference in millivolts between these two electrodes then establishes what the oxidation-reduction potential is. And it could be positive or negative. Again, there are continuous ORP and spot sampling ORP applications for measurement. The continuous probe shown on the bottom right hand is very easily incorporated into a spot sampling instrument as well.
Step 2 - Sludge Wasting
Sludge wasting controls how much biomass is in your system. And there are several approaches to sludge wasting. Settleability is one common usage and by comparing these results, a professional can decide whether or not additional or less wasting is needed. Other strategies are to maintain a constant mixed liquor suspended solids. Again, with grab samples, you could measure these samples in your lab on an analytical balance.
Centrifuge spin is another common method. And really, the spin is actually very versatile. By measuring samples of the mixed liquor, the return sludge, and the clarifier at once you can get an idea of the mass/balance. And also decide whether you need to waste or whether you need to change your return activated sludge (RAS) rate. But all of these methods have the drawback that they are batch samples and it can only be done when the operator is available and has the time to do them. Of course, the same is true of F to M and solids retention time if, for instance, you're taking grab samples or spot sampling with a handheld.
But I want to talk more about solids retention time in the subsequent slides here and how it can be a continuous monitoring process. So we have another cartoon here (below) showing again an aeration tank and a clarifier linked by the return activated sludge. And when we talk about sludge age or MCRT or SRT or CRT, they are all different calculations but in essence, they are a difference between the biomass in the system divided by the biomass entering or leaving the system. And to define an SRT calculation as the inventory or the wastage, we have, for a given SRT set point, neglecting the effluent total suspended solids, calculating the volume of the aeration basin, measuring the mixed liquor suspended solids concentration, measuring the return sludge concentration, you can then directly calculate the sludge wasting rate needed with this formula.
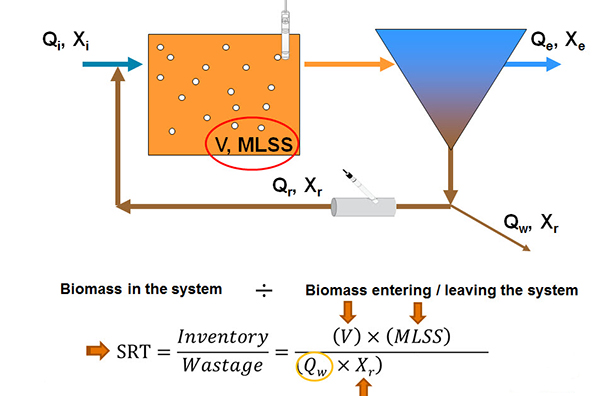
Of course, this is very easy to do with online measurement with, for instance, a suspended solid sensor and the aeration tank and an insertion style, suspended solid sensor in the return activated sludge line. So what should be the target SRT? Well, it depends on your treatment requirements. And I'm going give you some general guidelines here. And so as a number of functions increase, the target SRT has to increase. So, for instance, with the BOD removal only required, you would have a lower SRT requirement than you would for COD removal and nitrification. And that would be lower still than what would be needed for the BOD removal, nitrification, and denitrification. And up to a maximum of COD removal plus nitrification, denitrification, and biological phosphorus removal.
So let me offer an example of nitrification design. This chart here (below) shows nitrification SRT versus temperature on the horizontal axis. And the line there is a plot of an equation that defines that relationship so that the minimum SRT for your system depends on temperature. For instance, between 20 and 12 degrees C, which might be typical on wastewater temperatures. Of course, that being the minimum SRT, we want to make sure we give ourselves a safety factor. So a design could be based on something, a safety factor, for example, one and a half. And so you would be able to control nitrification by maintaining our SRT between 6 days at 20 degrees Celsius and 12 days at 12 degrees Celsius.
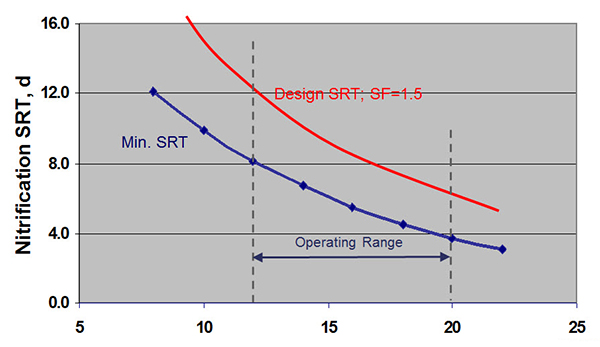
There are some trade-offs though to maintaining that higher SRT. There is a need to limit that SRT to the maximum extent possible. So if we look at ammonia removal efficiency versus sludge age a higher number is better. In this case, in the blue area here, we have inadequate ammonia removal. And in the red area here we have ammonia removal but its active sludge age leading to higher power consumption. And so the optimum sludge age is similar in between that allows you to achieve nitrification without excessive energy consumption.
Now besides nitrification, SRT has effects on a lot of other parameters. Looking at effluent TSS versus over one year of data, where a facility implemented SRT control, the effluent TSS is higher and more variable. And after SRT control is implemented, more stable with lower values.
When it comes to solids measurement then, of course, the gold standard is the laboratory calorimetric technique. But for faster measurements, there are optical ways in measuring solids and there's a couple of technologies. Reflectance or absorbance. The measurements are fast and simple which is very desirable. But if you have an online instrument, it is also factory calibrated and low maintenance with integrated cleaning systems. So, for example, with the UltraClean technology which is on this TSS probe shown here.
Spot sampling is also very commonly done. It can be done with a handheld like this one shown here. But one caution I want to offer is that the TSS spot sampling sensor is generally not factory calibrated and so it needs to be calibrated in the lab before taking it out to the basin. So especially when you're verifying measurements you want to have a properly calibrated handheld sensor.
Step Three - Sludge Recirculation (RAS and IMLR)
So, one reason for sludge recirculation is to control biomass distribution. And RAS flow is critical to clarifier performance. There are a couple of methods that are implemented. One of them is the constant flow method. And in this method you set the RAS flow rate manually, it's basically open loop control and only changes when you go to make the change.
A feed forward control of controlling RAS flow is to set it proportional to the wastewater flow. So, for example, 50% of the forward wastewater flow. The drawback to constant percentage is that you'll get the highest clarifier loading at the highest flows, so really at the worst possible moment. But constant flow, on the other hand, is most applicable then to smaller facilities. Now whichever method you're using, flow rate control can be based on a number of different approaches. I'm going to talk about one approach, the sludge blanket depth approach. And this diagram shows again a clarifier with wastewater flow plus the RAS flow coming in and the RAS flow and the effluent flow going out. On the right-hand panel is a flux curve. Forgive me, this would be something is more familiar to engineers but it's a very simple principle to understand.
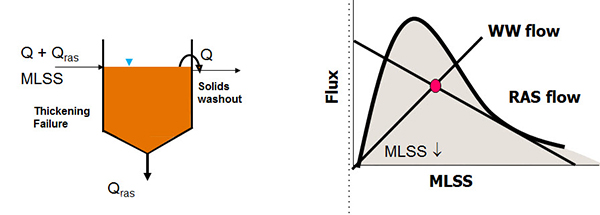
And the idea is that this flux curve defines the quality of your sludge. The idea is to maintain your operation below the curve. So let's look at an example. If we plot waste water flow and RAS flow on the chart, the intersection of those lines is our mixed layer of suspended solids concentration. In this example, that RAS flow line is outside of the curve and the result is that sludge will accumulate and the blanket will rise. And the worst case situation, that biometric continue to accumulate and the sludge would overflow the weirs and you have solids washout. But even if that part is avoided, the drawback to allowing that to happen is that the mixed liquor suspended solids concentration is reduced.
So looking at another approach is to increase the RAS flow rate, both flow lines and the state point, the magenta dot there are maintained within the curve. For a sludge blanket depth measurement, there are a couple of options. On the left-hand side is a visual measure which I'm sure many of you are familiar, it's a sludge judge. And these are core sample that you put into the clarifier and put it out and read how deep the sludge is.
On the right-hand panel is an instrument for doing that. And this instrument uses sound waves, so it's acoustic. And basically, it's measuring the echo from the sound waves hitting the sludge below. With the visual on the acoustic methods, they should generally get very similar results but under certain circumstances, for instance, when the sludge blanket is not very well defined, you can get a very subjective evaluation on the sludge judge and may or may not agree with your online blanket level sensor.
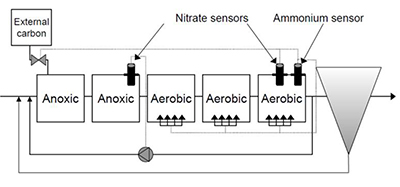
When talking about sludge recirculation for control of denitrification, nitrate is the critical measurement. And the diagram here is a denitrification configuration. And so the optimal location for nitrate sensors in this is to have a nitrate sensor at the end of the anoxic basin and a nitrate sensor at the end of the aerobic or oxic basin. And taken together, the measurements from this can help you to meet the three objectives for denitrification.
1) Meeting nitrogen limits
2) Maximizing the use of wastewater COD
3) Minimizing the external carbon dosage which is very expensive.
For nitrate measurement, there are also ion selective electrodes (ISEs) for that. So again, a potentiometric method where the difference in potential between the measuring electrode ISE and a reference electrode are measured. And these are then correlated to an ammonium or nitrate concentration. And the benefits of newer technology are that multiple electrodes can be fitted on this probe. So you can measure ammonium and nitrate simultaneously and also compensate with a potassium or chloride probe. They are reagentless, have a stable calibration, electrodes are replaceable and there's a large measuring range.
This is also possible with a spot sampling instrument. A digital sampling system can be outfitted with ammonium nitrate and even DO probes to measure those parameters simultaneously.
I want to offer another way to measure nitrate, though. ISEs do have electrodes to either replace from time to time and are not factory calibrated. An optical method for nitrate monitoring is shown here. It basically works by measuring the absorbance in the ultraviolet range. Nitrate absorbs ultraviolet light. Two different versions are offered, a multi-wavelength spectral instrument that is factory calibrated or a single wavelength instrument that requires a user correlation. The picture on the right side then is an online instrument in the mixed liquor and the inset there shows the measuring gap where the measurement happens. And it also can be outfitted with an integrated cleaning system.
So to summarize today's webinar, process control, it is easier than you think. It is a matter of using aeration to control the environment, sludge wasting to control the total biomass, and sludge recirculation to control biomass distribution.
The Question and Answers section of the webinar is also available as a download but the transcription is not provided within this blog post.


Additional Blog Posts of Interest
Total Suspended Solids Monitoring for Process Stability
The Science of Phosphorus | Blog Series | 1 of 5
Monitoring Orthophosphate for Reduced Chemical Costs in Water Resource Recovery Facilities
Myths and Realities: Ammonium Based Aeration Control in Wastewater