Water Quality Monitoring Supports a River Cleanup
(Updated November 2021)
To rock ‘n roll fans of a certain age—and Boston sports fans celebrating points with a verse or two of The Standells’ 1966 hit “Dirty Water”— the Charles River is synonymous with pollution. On its way to Boston Harbor, the 80-mile-long river winds through one of America’s oldest industrial regions, supplying water, power, and drainage to the hub of Massachusetts’ economy for more than 350 years.
As the Bay State’s economy soared in the 17th, 18th, and 19th centuries, water quality in the Charles experienced a steady decline. Slowed even further by a string of 20 dams installed before the end of the 1800s, its naturally sluggish flow ground nearly to a halt while pollution flowed in from the textile mills, factories, and cities along its banks. In 1875, the federal government recommended abandoning clean-up efforts on the lower half of the river and focusing instead on the upper reach. By the middle of the 20th century, combined sewer overflow (CSO) from Boston and Cambridge turned the Charles into a gutter during storms— an annual average of 28 CSO events and more than 1.7 billion gallons of combined discharge.
But in 1965, just months before the release of “Dirty Water” stamped the Charles with its grungy identity, a group of locals banded together to turn the river’s fortunes around.
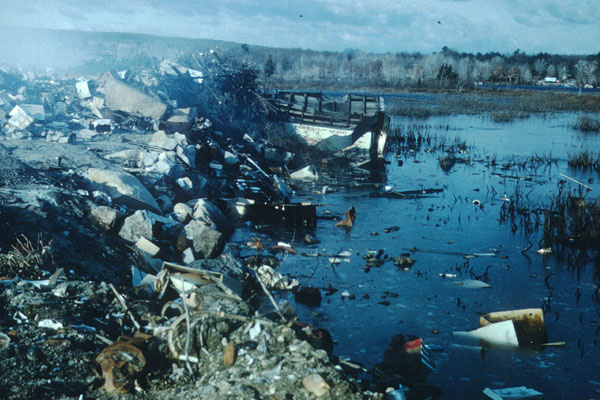
The Charles River became so polluted, that in 1875 government recommended abandoning cleanup efforts in areas. Photo credit: CRWA
New Report Card
“Charles River Watershed Association was formed in 1965 by a group who was disgusted by the state of the river and wanted to clean it up,” says Lisa Kumpf, an aquatic scientist who heads up the association’s field science programs. “Since then, we’ve been cleaning up the river by working with the cities and towns in our watershed to get combined sewers separated, to make sure that stormwater that is going into the river is clean. We also have advocacy and law branches of our organization to advocate for laws around stormwater and sewage.”
Improvements in water quality in the Charles have been documented by the U.S. Environmental Protection Agency. EPA began issuing an annual “report card” grade for the lower reach of the river in 1995 based on water quality data collected by the association’s volunteers.
“We still have a lot of work to do, but in 1995 the basin was estimated to have a grade of D and now, in 2018, the most recent grade was a B,” Kumpf says. “We have come a long way, but there is still work to do.”
The association—which goes by the acronym CRWA—was instrumental in opposing the construction of flood control dams in the 1960s that would have destroyed 8,000 acres of wetlands that now serve as valuable habitat and a cleansing buffer for the river. The group’s cleanup efforts got a significant boost in the 1980s, when the Massachusetts Water Resources Authority closed several of the combined sewer overflows that regularly dumped raw waste into the river, notes Max Rome of Northeastern University, who works with the Charles River Conservancy. Over the past three or four decades, separating stormwater and sewer systems, building new storm drainage systems, and closing CSO outfalls has reduced CSO discharges into the Charles River basin by 98 percent, and improvements continue.
“Especially from 1995 on, you start to see water quality getting better and better and better to where we are today,” Rome says. “If you look at the whole river, it would be safe with respect to E. coli-based bacterial swimming standards somewhere between 50 and 70 percent of the time, but there are certain sites that are safe for swimming close to 90 percent of the time during the summer.”
Blue-Green Algae: Growing Concern
Since 1995, volunteers have made monthly visits to CRWA’s network of 35 monitoring stations along the river to collect water samples and send them to a lab for E. coli testing. Additional samples are collected quarterly to test for chlorophyll, phycocyanin (a pigment produced by cyanobacteria, or blue-green algae), enterococci, turbidity, total phosphorus, total nitrogen, and several other parameters for a more comprehensive exploration of the river’s water quality.
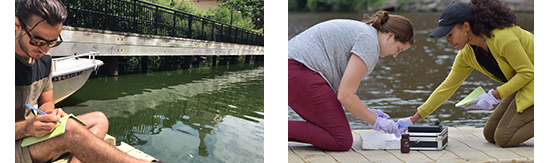
Charles River Watershed Association intern Glauco Cavino (image at left) records data during a 2019 harmful algal bloom. In the image at right, Lisa Kumpf (left) and Delilah Bethel of Charles River Watershed Association measure chlorophyll and phycocyanin during a harmful algal bloom.
In addition, CRWA taps into the data stream from the U.S. Environmental Protection Agency’s buoy-mounted multiparameter sonde, which measures temperature, dissolved oxygen (DO), pH, specific conductance, turbidity, chlorophyll, and phycocyanin every 15 minutes. The EPA buoy, backed by monitoring work by Kumpf and Rome, helps CRWA track blooms of cyanobacteria, which have been a growing concern for the association and other stakeholders along the Charles. (Learn more, Harmful Algal Bloom blog posts).
CRWA has been monitoring harmful algal blooms in the Charles since 2006 and is still discovering important details about them.
“People know a lot about E. coli bacteria and what kind of health effects it can have, but the research around cyanobacteria is not as robust,” says Kumpf. “Studying where we have continuous phycocyanin measurements is very valuable to see what’s going to happen with these emerging contaminants.
“The past several years, we’ve had at least one cyanobacteria bloom from mid-summer to early fall, and that’s largely due to excess nutrients that are in the river as a result of stormwater runoff and high temperatures,” she adds.
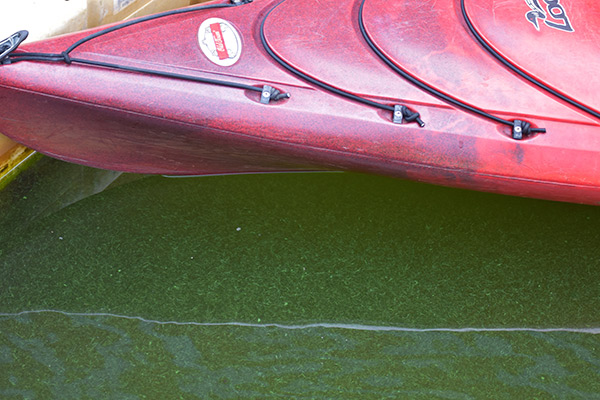
Though most of the conventional wisdom about harmful algal blooms tends to be based on studies of Microcystis, HABs in the Charles River tend to be dominated by Aphanizomenon.
Those blooms are a major focus in Rome’s research at Northeastern.
“One of the really interesting things about the blooms in the Charles is they are very dominated by Aphanizomenon, which is not one of the most commonly studied species,” Rome points out. “A lot of the guidances are written for Microcystis. What we see in the river is a little bit different, so we’re really interested in understanding what are the optical properties of Aphanizomenon? How do we track it? How is it responding to nutrient concentrations and temperature? And what are the cyanotoxins that are most associated with the species in the river?”
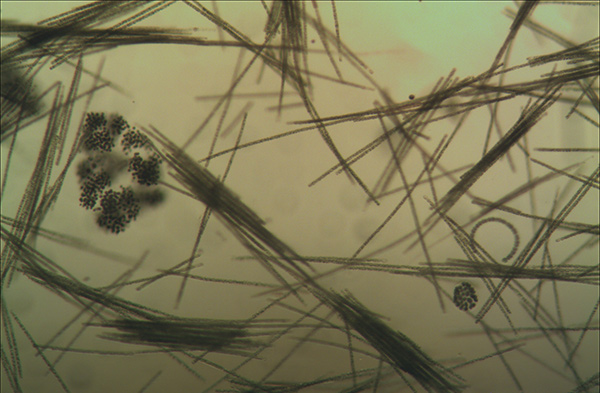
This 2017 algal bloom in the Charles River was dominated by rod-like Aphanizomenon, and also contained clustered Microcystis and crescent-shaped chain of Dolichospermum (formerly known as Anabaena). Photo by Max Rome.
Rome adds that stakeholders are also interested in one of the most basic mysteries of the blooms: how big are they?
Send in the Robots
CRWA got a unique opportunity to explore algal blooms in the Charles when Kumpf and her team partnered with YSI to deploy two of the company’s new robotic systems—the HYCAT Autonomous Surface Vehicle (ASV) and the i3XO EcoMapper Autonomous Underwater Vehicle (AUV)—in a reach of the Charles that includes a popular swimming area.
The HYCAT ASV is a six-foot-long, foam-filled catamaran designed to collect water quality, bathymetry, and flow data at once, says YSI Integrated Systems and Services Product Manager Tom Goucher. The 115-pound vessel houses a YSI EXO2 sonde with seven ports for water quality sensors; a SonTek HydroSurveyor M9 acoustic Doppler current profiler (ADCP) to collect data on current direction, flow, and discharge throughout the water column; a side-scan sonar for habitat mapping; a real-time camera; an onboard computer and 5.8 GHz wireless communications. (Watch Webinar: 5 Tips for Better Water Monitoring - Autonomous Surface Vehicles)
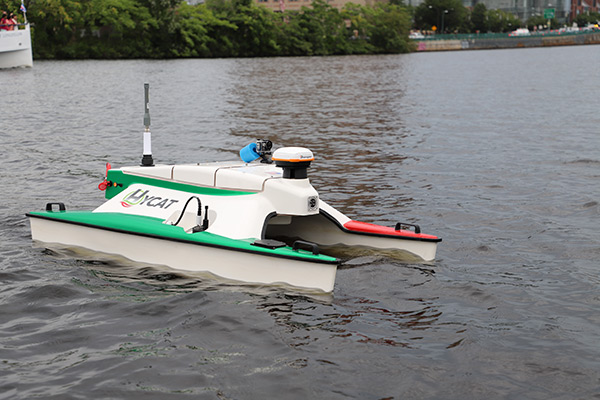
This HYCAT Autonomous Surface Vehicle helps CRWA researchers generate high-resolution water quality, bathymetry, and flow data at once along the river.
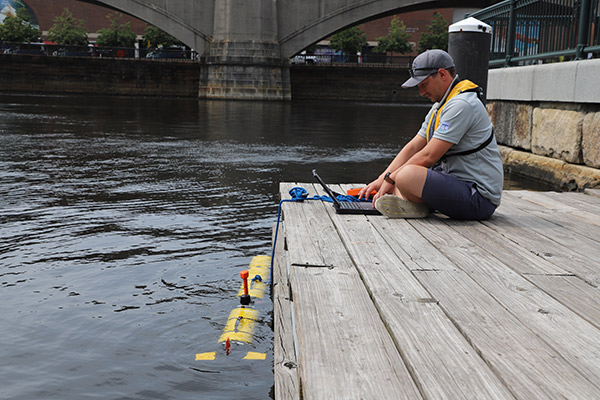
Using a georeferenced image of the study area, the HYCAT operator used HYPACK software to set a single GPS waypoint and pulled on a set of polygons to chart a “lawnmower grid” for the ASV to follow as it methodically gathered its data. The same software package provided real-time data visualization and post-processing.
Beneath the surface, the i3XO EcoMapper followed its own “lawnmower grid,” gathering up to eight water quality parameters with its nose-mounted EXO1 sonde and charts of the banks and bed with its bottom mapping system and side-scan sonar. (Watch Video: YSI i3XO EcoMapper Autonomous Underwater Vehicle | Data Collection)
Together, the two new autonomous systems provided detailed insights into the river that exceeded anything that had been collected in nearly four centuries.
The i3XO EcoMapper gathers up to eight water quality parameters beneath the surface with its nose-mounted EXO1 sonde, and charts of the banks and bed with its bottom mapping system and side-scan sonar.
“YSI developed these integrated systems in response to the growing need for algal bloom research and monitoring,” says Goucher, whose office, conveniently, is in Massachusetts. “The Charles River provided an outstanding opportunity to test how well we could map chlorophyll and other parameters, as well as physical characteristics of the river system, using the HYCAT and the EcoMapper.
“We are seeing remarkable versatility with these vehicles in real-world situations like the Charles, operating in currents up to 6 knots,” he adds. “These are going to be extremely powerful tools for people like Lisa and Max who are studying rivers, ponds, estuaries, and nearshore systems.”

Innovative software allows the technician to plot a course for the autonomous systems using a georeferenced image of the study area.
In addition to sales of HYCAT or EcoMapper units, YSI has developed new service-based programs.
Kumpf and Rome are eager to put the autonomous systems back to work in the Charles during an algal bloom.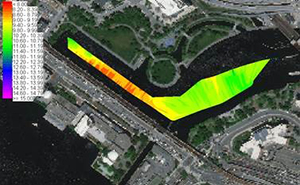
“Being able to get the HYCAT or the EcoMapper into the water during a bloom would be so incredible because it would give us a chance to see the profile and the cell density throughout the whole basin,” says Rome. “That’s a really big question right now that nobody has the answer for.”
Detailed insights to the river were collected by the new autonomous systems that exceeded anything that had been collected in nearly four centuries.
Big Changes
After centuries of acting as an open sewer for the communities along its banks, the Charles has become the centerpiece of CRWA’s Blue Cities Initiative. Through Blue Cities, CRWA evaluates opportunities for restoration projects that work with—rather than against—the watershed’s natural hydrology. Through projects that range from building retrofits to runoff treatment basins and greenways, the association is developing cost-effective stormwater management systems and helping beautify the 35 communities in the watershed.
But challenges persist.
“It’s so much better than it used to be, but we still face a lot of issues and we are going to see those issues become worse with climate change,” warns Kumpf. “For climate change in the Northeast, we’re looking at higher levels of precipitation and more intense storms that make combined sewer overflows happen more often and cause more issues with stormwater runoff. So making sure that we are investing now in the water quality we want to see in the future is very important.”
That should give a new generation of Boston songwriters something to sing about.

Additional Blog Posts of Interest
Data-Driven Decisions Improve Lake Health
5 Tips to Prevent Costly Mistakes with Your Water Quality Sonde
The Latest in HAB Research and Technology