Mapping an Oil Leak with an AV and EXO Sonde
On the southwestern coast of Massachusetts, Brayton Point, in Mount Hope Bay, sits directly across from the city of Fall River and its 90,000 inhabitants. It was formerly home to the largest coal-fired power plant in New England. After over 50 years of operation, the plant was decommissioned and sat dormant for two years until it was demolished in 2019. Since then, it has been used as a deep-water port for scrap metal operations.
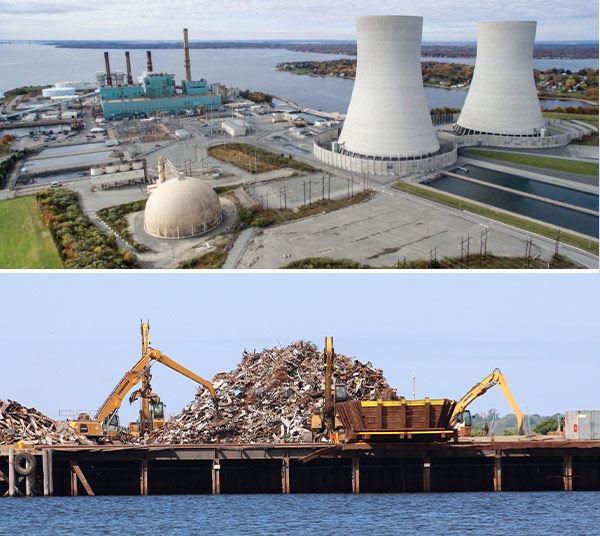
Brayton Point power plant (above). Image courtesy of Commercial Development Company. Deep water port for scrap metal operations (below).
In May of 2021, one of the large ships that came in to load and offload scrap metal had leaked fuel into the Bay. Initially, containment booms were placed to control the leak, but they were later removed, and it was decided that steps would be taken to dissipate the fuel into the rest of the Bay. A small boat was driven around to assist in the dissipation.
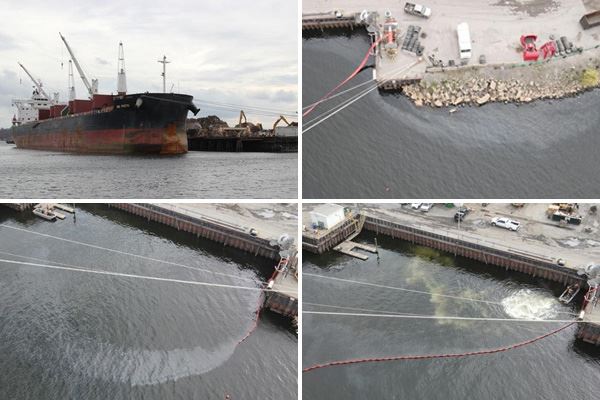
Oil spill in the bay.
Our Systems & Services Product Manager, Tom Goucher, and our Vehicle Specialist, Shawn Sneddon, work out of the Xylem office in Fall River. And they decided to take the newest member of the YSI fleet of water vehicles, the rQPOD, out to the Bay to run a survey and see if we could detect the fuel leak. The deployed rQPOD was equipped with an EXO2s Sonde and an EXO Handheld Display with the following sensors:
They sought to answer the question: Can the fDOM sensor detect the fuel leak?
But first, we should answer why was the rQPOD the best vehicle for the job?
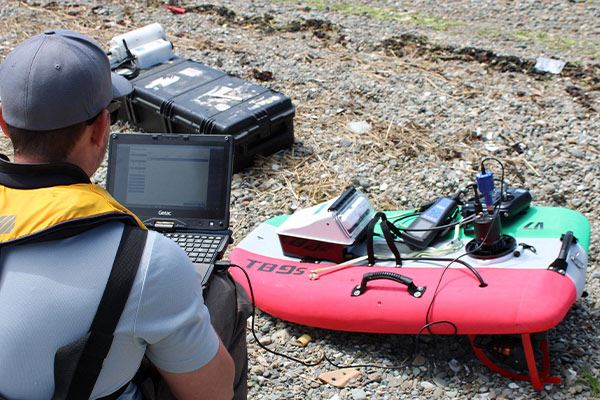
Shawn Sneddon, YSI’s Vehicle Specialist, preparing a mission plan for rQPOD.
Why rQPOD?
The rQPOD is a modular surface vehicle system. It’s light, portable, easy to use, and can be operated autonomously or remotely. It allows users to collect data over a large spatial area in minutes, and its small size allows easy access to areas otherwise inaccessible. It has real-time data visualization options that enable users to make mission changes and decisions on the spot.
Shawn programmed the vehicle to run its mission autonomously and set it to collect samples every one hertz. Autonomous missions allow the rQPOD to run in straight lines at precisely spaced intervals. The spacing for this mission was set to 25 meters, but should be tightened to 10 meters for any applications using side-scan sonar or for a bathymetric survey. After the autonomous mission through the Bay, Shawn ran the rQPOD manually via remote through the shallow estuary adjacent to the Bay.
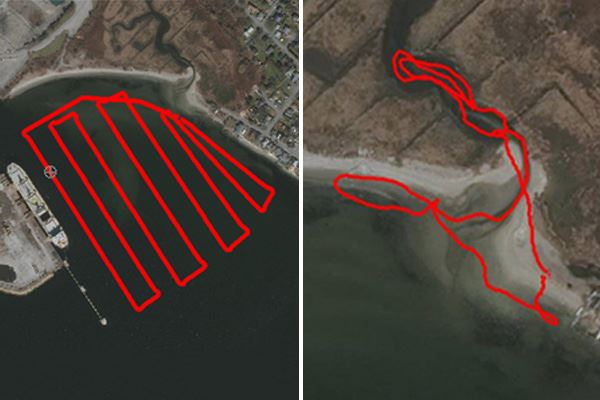
Vehicle path in the Bay (left) and in the Estuary (right).
Data collected can be viewed in real-time or downloaded after the survey. Real-time data gives the benefit of identifying areas of interest or hotspots during a survey, and then you can re-task the vehicle to go back to that location to look at it in more detail. It affords you the ability to instantly see what’s going on and make immediate decisions if there are any areas of concern.
Xylem’s HYPACK software can be used for mission planning, data collection, and real-time data analysis. They were able to stitch the data sets from the autonomous and remote missions together to give a total picture of the data collected that day.
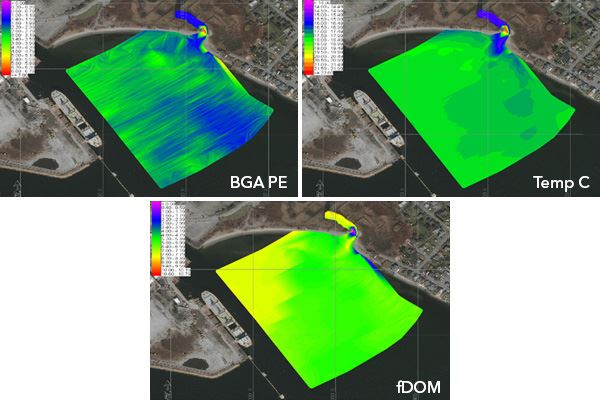
Stitched data from the Bay and Estuary displaying BGA PE, Temp C, and fDOM.
Why fDOM?
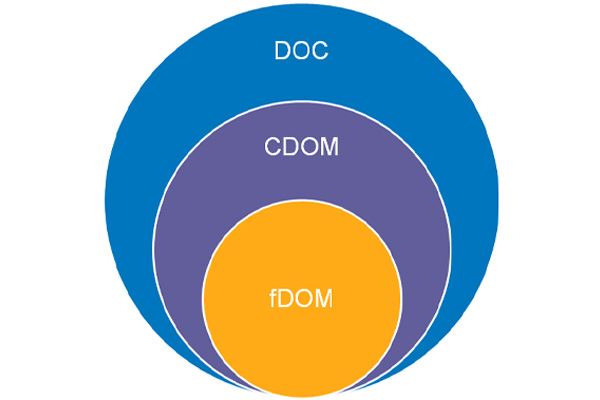
Most carbon on the planet is stored as a huge reservoir of dissolved organic carbon (DOC) in the ocean, and the majority of this is recalcitrant DOC that’s been stored for eons. However, there is a continuous delivery of carbon into coastal waters from rivers. That’s a significant source of carbon flux, including what we call cDOM (colored dissolved organic matter). There is a fraction of cDOM that is also fluorescent, called fDOM (fluorescent dissolved organic matter).
So, depending on the environment you’re in, 20-70% of DOC could be fDOM. This raises the question, can you use fDOM as a surrogate measurement for dissolved organic carbon in certain environments, for which we have minimal ability to do sensing in real-time? A team from the University of South Carolina Marine Science Program conducted a study to evaluate the efficacy of EXO’s measurement of in-situ fDOM to serve as a reliable and robust proxy for DOC measurements. Read the blog post, Southeastern Estuarine Research Society Meeting fDOM Sensor Research, or the assessment to learn more.
The fDOM sensor is one of many technologies that can measure fluorescence on the excitation and emission spectrum. Fluorescence includes an excitation wavelength, and in the case of the EXO sensor, the wavelength is 365 nanometers, but the emission wavelength is 480 nanometers. So what this spectrum is showing you is that these different peaks represent different types of matter that fluoresces on the spectrum.
Peak A & Peak C represent terrestrial sources of human and folic acids. Peak C typically contains the highly colored humics and is usually what the fDOM sensor is most closely associated with (see the white star on the chart below). We know that crude oils also fluoresce in about the same range (see the red star on the chart below), and that was the basis for our hypothesis that if you’re in an environment where you don’t have a lot of other dissolved organic matter, the fDOM sensor could probably be a pretty good surrogate measurement for crude oil.
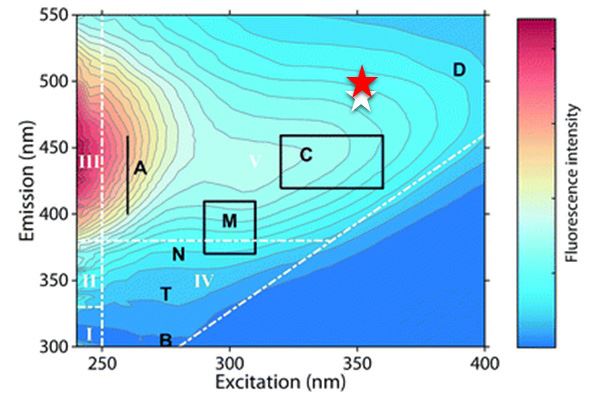
Emission and excitation spectrum
Did the fDOM Sensor Detect the Leak?
It certainly appears that’s the case when you look at this example in Brayton Point. You can definitely see that there is heightened fDOM in the region near the leak, but it’s important to point out that you also see a lot of fDOM in the estuary. If you’re in an environment that already has a lot of fDOM, this approach might not work. But if you’re in a coastal or ocean environment, where you might not expect to see a lot of fDOM, this could be a really useful tool for looking for oil leaks. Even outside of this application, an fDOM sensor is an excellent tool for looking at DOC overall.
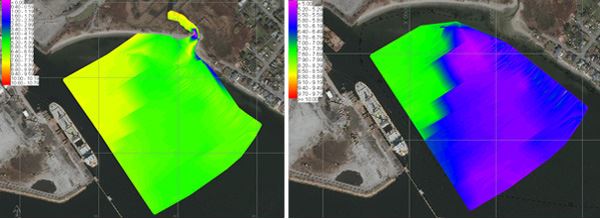
Map of fDOM in the Bay and Estuary (left) and in the Bay only (right).
We learned that the fDOM sensor definitely could detect crude oil in this application, but it’s not going to be able to tell the difference between crude oil and true fDOM material in your water. So it’s an effective broad-scale surveying tool, particularly when you couple it with one of these vehicles. But we would probably advise that you also potentially “ground-truth” it with a grab sample or another sensor.
Learn more at https://bit.ly/YSIandScripps