Stormwater Monitoring for a Refinery’s NPDES Permit
(Updated February 2026)
Recently, a colleague told me about an integrated turnkey system he’d designed for a contractor who was helping an oil refinery with stormwater monitoring.
“Huh?”, you may be asking. An oil refinery?

Why is Stormwater from Refineries Regulated?
In rural environments, rainfall soaks into the ground. With heavy rainfall, there is either not enough time for the water to be absorbed, or the ground becomes so saturated with water that it can’t take in any more. The excess water runs off into creeks, tributaries, rivers, and so forth. Even seasonal snow and ice melt after a winter of heavy precipitation can lead to excess water running off into streams, rivers, and lakes. In cities, paved surfaces and rooftops are impervious to rainfall, which collects rapidly and flows into gutters and drains. The engineered drainage systems deliver the excess water directly to rivers, canals, ports, or other water bodies.
In all cases, the excess water is called stormwater, and stormwater ranks alongside erosion and harmful algal blooms as the U.S. EPA’s top three climate change concerns.

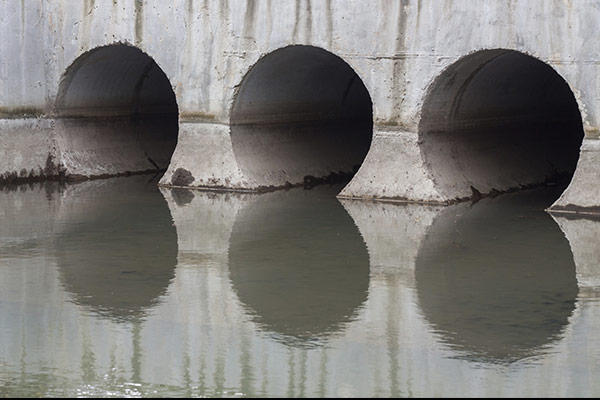
An oil refinery is like a city: lots of paved surfaces, lots of rooftops, lots of steel, and other impervious materials. Wastewater management at a refinery thus mirrors what happens in a city. The sources of wastewater are cooling waters, process water and steam, sanitary sewers, and of course, stormwater.
Also like a city, a refinery’s stormwater can contain many concerning things. Both city streets and the paved areas of some refineries will bear petroleum-derived liquid hydrocarbons, as well as dust and dirt that become suspended and dissolved solids in stormwaters. Refineries can also yield stormwaters with unacceptably high concentrations of phenols, cyanides, and acids (sulfuric and hydrofluoric).[1]
Refineries are responsible for managing their stormwater runoff because of these pollutants, and many refineries additionally choose to contribute to regional environmental monitoring programs to understand the impacts of their operations. Participation enables cooperation with state regulatory agencies that are authorized by the U.S. EPA to manage the NPDES, which oversees discharges to waters of the U.S. “Waters of the U.S.” is a definition at the center of efforts to chip away at the Clean Water Rule in recent years. Environmentalists have been valiantly defending that definition in the decades since 1972 when the Clean Water Act came into existence.
NPDES and the Oil & Gas Stormwater Program
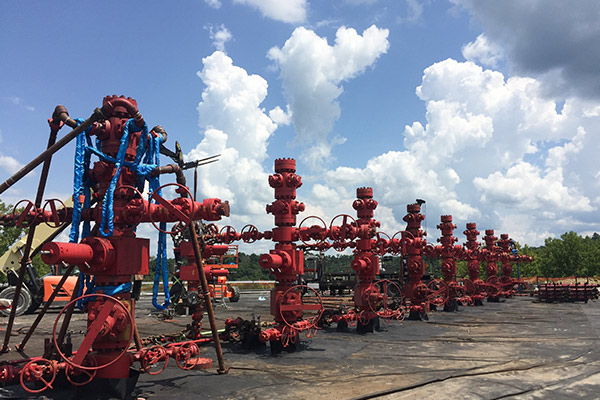
In the case of refineries, effluent guidelines and standards were first put forth in 1974, and the most recently amended version of 40 CFR Part 419 (1985) is incorporated into the NPDES permitting standards for direct discharges for oil and gas facilities and activities. Clean Water Act Section 402 specifically regards stormwater, and Section 402 (l)(2) describes both Exempt and Non-Exempt Oil & Gas Facilities and Activities. Section 402 (l)(2) actually was added to narrow down the scope of oil & gas activities that are regulated for discharges, and there is a long history of finding avenues to exemption in the industry. Where things generally stand today is that oil and gas exploration activities are mostly exempt, but the facilities where raw materials are refined into finished goods are not exempt. So the facilities that most of us think of as a “refinery” will often have a stormwater NPDES permit, depending upon the state where they are located.
In an ideal world, a refinery would capture all the runoff through specially-designed infrastructure, and measure water flow and concentrations of the contaminants prior to discharging that stormwater. This would enable flux and loading rates to be readily calculated and evaluated against the levels in an NPDES permit.
If the concept of loading is unfamiliar to you, it is explained quite eloquently by my colleague Dr. Xue Fan of SonTek in a webinar we recently did about nutrient loading, Why Collect Water Quality Data Whan All You Need is Flow (or Vise Versa!). The figure below is directly from her presentation:
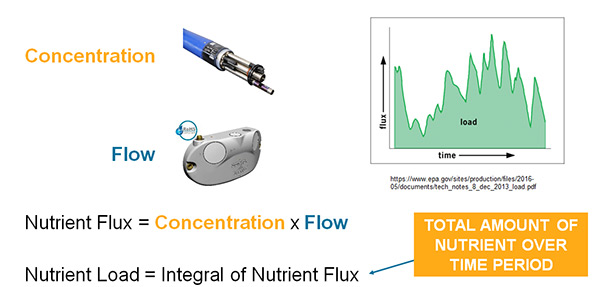
As Dr. Fan explained, one could use an EXO sonde with a NitraLED sensor to monitor the concentration of nitrates, and a SonTek-SL to measure flow. These two instruments could ultimately enable one to understand flux and loading (the integral of the curve under the flux vs. time plot). Dr. Fan talked about nutrient loading in the webinar, but the same is true for stormwater pollutant loading introduced via stormwater from refineries.
To better understand stormwater monitoring for oil and gas refineries, I encourage one to read this 2007 report by Banks and Wachal of the City of Denton, Texas. Their study was “…designed to evaluate stormwater runoff from natural gas well sites.” Banks and Wachal described that, unlike the ideal scenario described above, drainage patterns at refineries are irregular and difficult to trace. The infrastructure does not capture all or even most of the runoff. Thus it is difficult to estimate both the concentration and the flow of the pollutants. As a consequence, the estimates of stormwater-facilitated loading of pollutants into nearby waterways can be highly inaccurate.
In practice, then, flow monitoring is often conducted in the nearest stream or tributary that is known to collect stormwater runoff. Since that measurement is not directly at the stormwater source (the refinery), it is difficult or impossible to know the concentration of pollutants that actually came from the refinery. An approach to derive the Event Mean Concentrations (EMCs) to be expected for contaminants of concern was thus described.
A refinery can assess the EMCs against national standards for water quality in drinking water sources and for protection of aquatic life. Working with state agencies that are administering the NPDES permits on behalf of the EPA, compliance with the discharge permit might come down to simply monitoring flow into the receiving waters on a continuous basis.
And that is where our story comes full circle because measuring volumetric flow means you have to be able to measure the water level in an open channel, as well as the dimensions of the channel, and the velocity of the water, in order to calculate volumetric flow. How the heck do you do that?
One Sensor To Conquer NPDES Stormwater Reporting: The SonTek-IQ
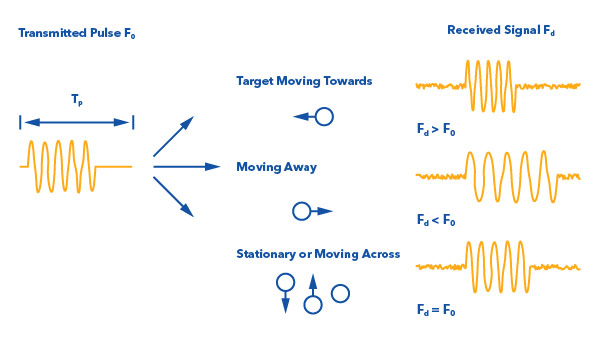
The SonTek IQ is an all-in-one flow, total volume, level, and velocity sensor and it is designed for ease of use. Even though it’s easy to use, the underlying principles of how it works are rooted in sophisticated physical principles, especially the Doppler shift principle. This white paper from my SonTek colleagues explains the principles of the Doppler-based technology in some detail; I borrow from their expertise below.
SonTek-IQ products are monostatic, meaning that the same transducer is used to both transmit and receive sound. The transducer sends a pulse of a known frequency (Fo), and some of that is reflected back to the receiver. The comparison of the received signal (FD) with Fo over time ultimately allows one to understand water velocity. Yes, that is a GROSS oversimplification, but this information, combined with user-supplied dimensions for the channel, is what will yield a highly accurate calculation of the volumetric flow.
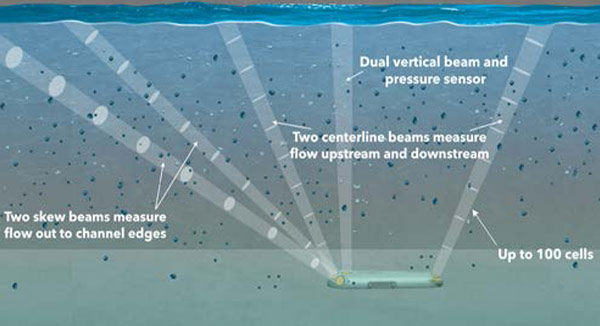
One dimension for the calculation of volume does not get supplied by the user, though, and that is the height of the water above the instrument. A pulsed vertical sound beam is the principle measurement for water level. A pulsed Doppler system uses two or more acoustic beams to receive signals that have reflected off particles suspended in water. Each acoustic beam is “divided” into discrete cells that measure the water velocity in layers throughout the water beams. One of the five total beams in the SonTek IQ is the vertical beam.
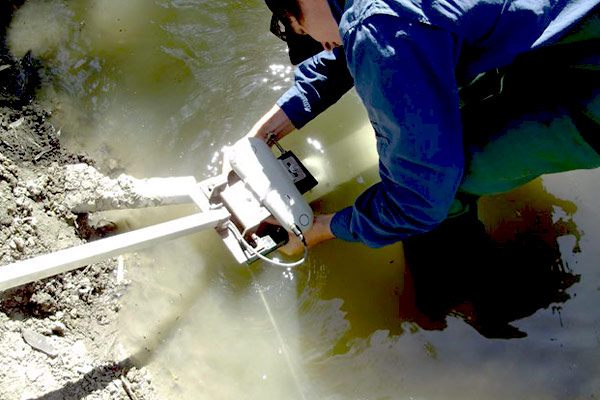
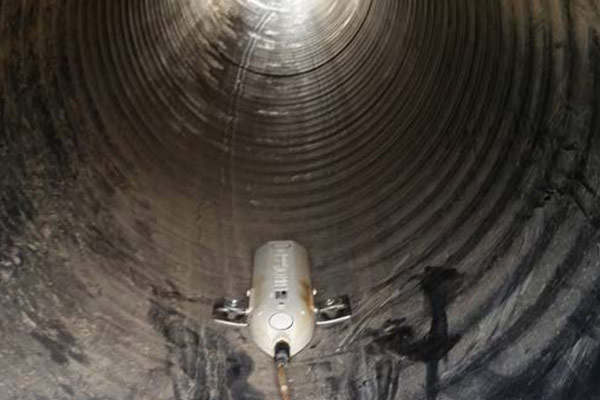
A short sound pulse is sent vertically, and the reflection from the water’s surface is very strong and clearly defined; it is distinct from the reflections that come from particles in the water. The algorithms within the IQ enable the receiver to distinguish the surface reflection from other signals, so the time to return the signal enables the IQ to measure the distance from the bottom-mounted sensor to the surface. The IQ can measure up to 1.5 m of water above the transducer (the IQ-plus can go up to 5 m) and can measure water as shallow as 0.08 m. Its low profile makes it a very popular choice for placement in streams and tributaries, as well as stormwater drains like the one shown below.
A pressure sensor is used as a secondary measurement of water level just in case something obstructs the vertical sound beam or its reflection. The water pressure on a pressure transducer is influenced not only by the depth of the water, but also by the barometric pressure exerted by the atmosphere upon the surface of the water, and the density of the water. The pressure transducer in the IQ is not vented, however, the SonTek-IQ uses the vertical beam depth measurement to calibrate the pressure sensor in real-time, to remove fluctuations in pressure due to atmospheric pressure changes. Note that salinity is not automatically compensated for—it is user-defined. That might be measured using something like an EXO1 sonde or manually with a ProSolo with an ODO/CT cable.
If the only parameter of interest at a site is level, the IQ might be overkill, and a bubbler or radar might be a better choice. However, if water level is being measured for the purpose of understanding volumetric flow in a channel, the IQ is hands-down superior to other sensors. That’s because the Doppler technology is sending pulses from multiple directions, not just vertically, and this will enable measurement of the flow throughout the channel (flow is not always identical at all positions in the channel). The acoustic Doppler technology also allows the velocity of the water to be measured.
The water’s velocity and the volume occupied by the water are used to understand the volumetric flow passing per unit time, generating units like cubic meters per second of water. If the concentration of a pollutant is estimated using EMC, or measured via an autosampler and lab analysis, or in real-time using a sonde, loads can be calculated for assessing NPDES compliance.
This principle has been put into practice by innumerable YSI customers, but recently was employed by that refinery customer that my colleague told me about. More about their application is described below.
One Refinery’s Solution: An Integrated System with the SonTek-IQ
In 2021 a refinery in Texas wanted to take a proactive stance on their NPDES stormwater permit, both to stay in compliance and to protect the nearby tributary that receives their stormwater. That tributary feeds a large and cherished river in the region that all, including employees of the refinery, enjoyed. This monitoring project had unique requirements that led a contractor working with the refinery to YSI’s Integrated Systems and Services team.
In keeping with the strategy described above, flow monitoring was the primary aim. Members of the project described the monitoring sites as “the middle of nowhere,” and the construction of supporting infrastructure to support equipment was not feasible. The monitoring system would be deployed at this remote location, so equipment needed to be lightweight and easy to carry. The system needed to be installed in less than half a day by two people. The location would also limit site visits so the equipment needed to be low-maintenance and highly durable, and data telemetry was a must-have. Finally, ease of use was critical for their application because the operators were not experts in water monitoring technologies.
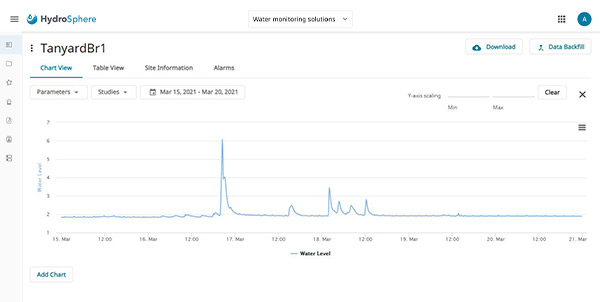
The system YSI designed centered on the SonTek IQ to capture the volumetric flow information; the refinery would capture its own EMCs using other sampling approaches. A nearby cell tower made cellular communication the best option for data delivery. The IQ data was communicated via an SDI-12 protocol to a compact and easily set up Storm 3 data logger equipped with a cellular modem to transmit data to HydroSphere. Via the web-based HydroSphere platform the data are visible to anyone the client decides to grant access to, and there is 24/7 support if there are ever transmission disruptions. HydroSphere can also enable one to set up alerts when flows are concerning, and personnel might want to do more sample collection for pollutant analyses.
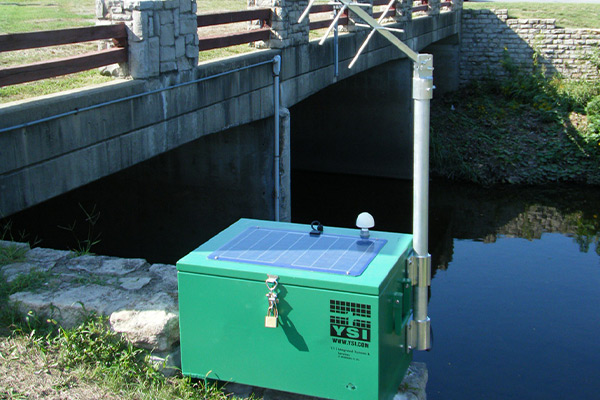
All of this gear was housed in a portable data collection platform (DCP) chest designed by YSI. This rugged chest is a welded powder-coated aluminum NEMA 4X enclosure able to withstand the harshest environments, yet easily carried by two people. YSI engineers have designed an uninterrupted integrated solar power system with this enclosure which ensures long-term autonomy, and even battery voltage is reported to HydroSphere to keep tabs on system operability. The DCP and SonTek IQ were delivered fully assembled to make installation on site as easy as possible.
Combined with pollutant concentration data collected by both the refinery and the Texas Commission on Environmental Quality, who administers the NPDES program in that state, this refinery will be able to understand and mitigate its stormwater discharges.
[1] Petroleum Refining, by J. H. Gary, G. E. Handwerk, M. J. Kaiser, 5th Edition, CRC Press NY, 2007, Chapter 13, Supporting Processes, pp. 290-293. As summarized at https://www.e-education.psu.edu/fsc432/content/wastewater-treatment, accessed on 15 April 2021.