Changing Water Quality Nutrient Monitoring Forever!
Editor’s Note: The following transcript has been edited for readability.
Video Transcription
Transcript by Speechpad
Brandon: Hello, and thanks for joining us today for our webinar!
YSI is changing nutrient monitoring forever, and we are so excited that you can join us today for our big reveal. And today is going be a little different than any webinar you've participated in the past. Because instead of focusing on teaching best practices for water quality monitoring, we're going to talk about brand new technology we've been developing for nutrient monitoring over the last couple of years.
We have a great representation of environmental scientists around the world at today's event. And you all know that the effects of nutrient pollution, both point and nonpoint source pollution, just can't be ignored anymore. It's an increasing problem globally, and as YSI is a chief technology provider for environmental scientists, it's our responsibility to help you find solutions to this ever-increasing problem. That's what this webinar is all about.
Today, I have several YSI team members with me to walk us through this new technology reveal. We have Lisa Landry, our technical sales representative, and Kerry Hubbard, our outdoor water monitoring specialist. And we also have Zack Henderson with us, our product manager for environmental monitoring systems. He's our techie. He's the guy who makes the technology come to life.
And then last, but not least, I'm Brandon Smith. I'll be your host.
Today, we will talk about nutrient monitoring and its importance, level-setting on why we need to monitor for various nutrients in our waterways. We'll then discuss the challenges scientists face right now when collecting nutrient data. Next, we'll talk about what the future of nutrient monitoring programs can look like going forward. And last but not least, we will finally reveal new, groundbreaking technology from YSI—technology that we've been working on for quite some time and are excited to share.
So let’s kick things off by passing it over to Lisa Landry. And Lisa, why don't you walk us through the importance of nutrient monitoring?
Lisa: Thanks, Brandon! I'm so excited to be here with everyone today to talk about the importance of nutrient monitoring!
One of the most critical water quality parameters that we can measure is our nutrient levels because of the drastic impact they can have downstream. These nutrients, primarily nitrogen and phosphorus, are fundamental components of living organisms. However, too much nitrogen and phosphorus can have a detrimental impact and far-reaching impacts on public health, the environment, and our economy as well. These excessive nutrient levels can dramatically alter aquatic environments.
If we look at the primary sources of nutrient pollution—reviewing the three main sources—agriculture is number one, starting with fertilizers. Since the mid-1920s, humans have doubled the rate at which nitrogen is deposited onto our lands through the production of fertilizers. We know that these nutrients and fertilizers are essential for an abundant food supply. However, our crops take up only 40% of the nitrogen supplied each season, leaving the rest to drain downstream and leading to high nutrient loads.[1]
Also related to agriculture and high nutrient levels is animal manure. Runoff from extensive animal facilities can carry manure into our waterways, leading to high nitrate levels as well. Effluent discharge from wastewater treatment facilities can also contribute to the issue.
And so, what are the impacts? What do high nutrient loads and high nitrate levels in our waterways lead to? One of the biggest problems is eutrophication. It’s a huge environmental issue. Despite many federal and state efforts to control sources and transport, nutrient concentrations in our rivers and aquifers have largely remained the same or increased since the '90s. We'll also talk a bit about how nutrient levels and high nitrate levels can drive the growth of harmful algal blooms, which will also have a downstream impact and a significant impact on both ecosystems and economics.
And last, we can't ignore the health impacts high nitrate levels can lead to in our drinking water. Whether our drinking water is from source water reservoirs or groundwater, high nitrate levels can undoubtedly impact our overall health.
The EPA in the United States has shown that excessive nutrients impair over 15,000 water bodies. And we know that over 100,000 miles of streams have a high nutrient load.[2] But we also know that it's not just a U.S. problem. Globally, if you look at the Atlantic coast of Europe, over 65% of that coast has symptoms of eutrophication and high nutrient or high nitrate levels.[3] And if we look back at the United States, 3.5 million acres of lakes and reservoirs are impaired by nutrients. So, it's a big issue that we want to dig into a little more.[4]
Let’s quickly recap the eutrophication process and how it leads to a chain of environmental challenges. If we're looking at the primary sources of eutrophication, we know that our farming and agricultural practices—as well as industrial practices—can release nitrates and nutrients into our waterways. And what happens is these high nutrient loads flow into the waterways, feeding fuel to a fire, feeding the existing algal communities, creating large-scale algal blooms. (Visit blog articles specific to algal blooms).
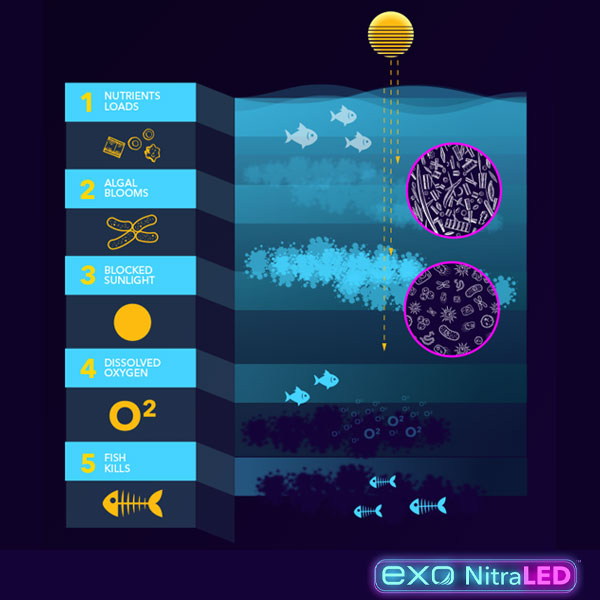
And once these algal blooms grow in size, they begin to block sunlight from reaching the water column. Now you've got decreased sunlight levels, high levels of algae, much of which dies, bacteria come in, and you start to deplete the dissolved oxygen in the water. This lack of oxygen can lead to dead zones or areas of hypoxia, where the system is devoid of life. These conditions lead directly to large-scale fish kills.
One of the great ways to see this process play out in the United States is in the Mississippi River Watershed, which drains about 40% of the continental United States. Many of those states within the Mississippi River Watershed are top agriculture producing states. So, as you can imagine, there are high nutrient loads all funneling into this basin. And it funnels in and goes through my home state of Louisiana, and then just kind of pours off to the coast into the Gulf of Mexico.
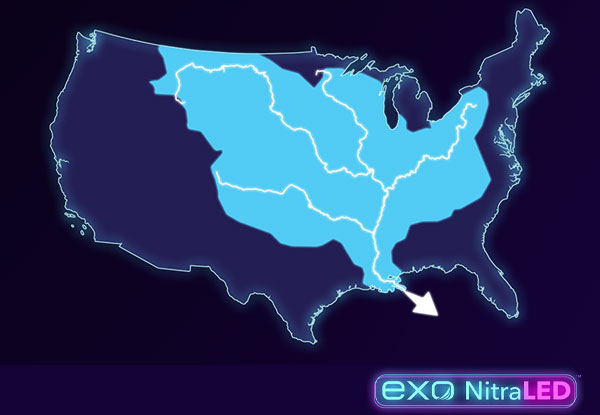
So, what happens when that nutrient-laden water goes into the Gulf of Mexico? Unfortunately, what we've seen year after year, are dead zones—or areas of hypoxia—forming. The size of which varies depending on the nitrate levels back in earlier in the spring, flood levels, and the amount of water flow. But these dead zones can be larger than the state of New Jersey!
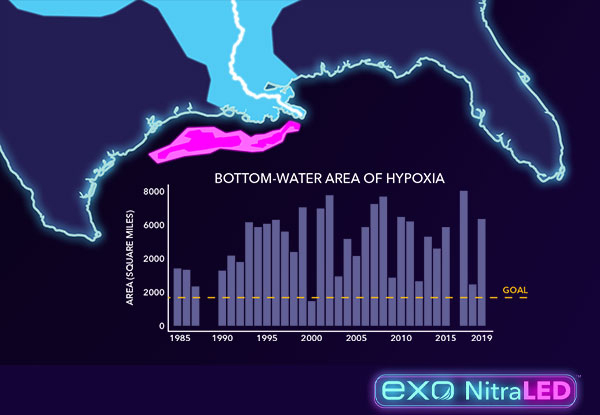
For the last 25 years, Dr. Nancy Rabalais at LUMCON and researchers from LSU studied this dead zone or hypoxic area in the Gulf of Mexico. You can see on the chart, the Gulf of Mexico Hypoxia Task Force set a goal to reduce the bottom water area of hypoxia to 2,000 square miles. However, you can see that our five-year running average is more like three times that goal, running around 6000 square miles every year.[5]
However, as I said, when we're looking at high nutrient loads, we're not just looking at the United States. We know that it's a global issue. There are over 550 estuaries globally impacted by eutrophication and high nutrient levels.
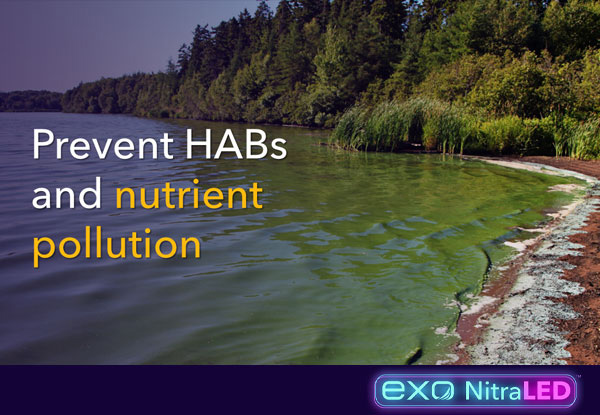
Now let's dig deeper and discuss the impacts of high nutrient loads in more detail, specifically concerning harmful algal blooms (HABs). At YSI, we have done quite a few presentations on this subject recently, as we've seen harmful algal blooms grow in scale and frequency over the last few years. These HABs can have detrimental health, environmental and economic impacts.
Just this past year, in the state of Mississippi, that Mississippi River nutrient-laden water caused all of its 21 beaches to shut down for a couple of months. And it was estimated that it impacted $4.1 million in tourism for hotels in Coastal Mississippi for just two months. The year before, in Florida, businesses reported $90 million in tourism losses due to harmful algal blooms.[6]
We also know that harmful algal blooms can impact your property values. Some economic studies have looked at property values in areas prone to HABs and saw a 22% decrease in home values.[7]
We also can't forget that harmful algal blooms can lead to hypoxia and dead zones, and these can certainly impact our commercial fisheries. The estimates range from $13 million to $25 million, with an average of $18 million in impact every year to our commercial fisheries from HABs.[8]
The medical expenses associated with harmful algal blooms—from respiratory issues to rashes—are estimated at $22 million annually for treatment.[9]
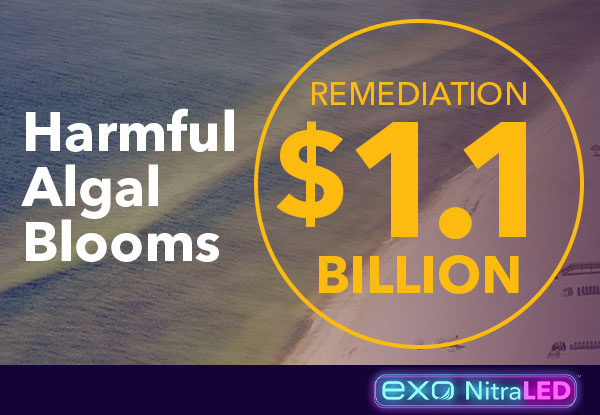
And then this is the one that always gets me, remediation costs. It’s always more expensive than actually treating the source of the problem. Since 2010, it's estimated that we've spent over $1 billion in the U.S on remediation for harmful algal blooms, such a vast number.[10]
So, there’s a hefty price to pay for nutrient loading—ecologically, economically, and even to our health.
If we look at drinking water, we know high nitrate levels can harm our bodies—from blue baby syndrome to neural tube defects and reproductive issues, as well as some cancers.
Brandon: Thanks for discussing the importance of nutrient monitoring, especially for nitrate levels. Kerry, why don't you walk us through the challenges scientists currently experience when collecting nitrate data?
Kerry: Thanks for the introduction and for passing things over! And thank you, Lisa, again, for the thorough introduction to the importance of nutrient monitoring!
So, with all of these terrible environmental events happening around us, it's challenging for a scientist not to want to tackle this nutrient pollution issue head-on. Nitrate and phosphorus are the two nutrients commonly referenced as causes of eutrophication, harmful algae blooms, and drinking water issues. But while phosphorus tends to bind to sediment, nitrate is completely soluble in water, making the challenge of nitrate control a lot more complicated than that of phosphorus.
So, while we all want to get our chemistry sets out and create something to fix this problem, perhaps grabbing those bulldozers to do some heavy remediation like Lisa referenced earlier, at the end of the day, we're just not able to for a few reasons.
First, monitoring for nutrients sounds like an enormous task to take on in a world where budgets are shrinking, and the geographical areas to monitor are ever-expanding. How are we able to develop a meaningful monitoring program? Groups are limited on personnel and equipment, so many tend to collect weekly or monthly grab samples instead of continuous data.
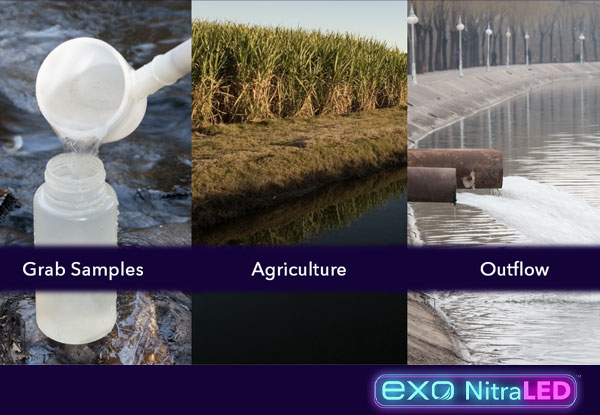
It's also tough to choose which sites to monitor to provide the best (and most useful) data. Are you going to monitor this branch of the river where we know that the agriculture industry dominates, or maybe it's best to monitor where the industrial outflow is? Or perhaps you even need to monitor further downstream where the two combine. Many of these environmental organizations might only have one instrument to deploy, making this a really tough decision.
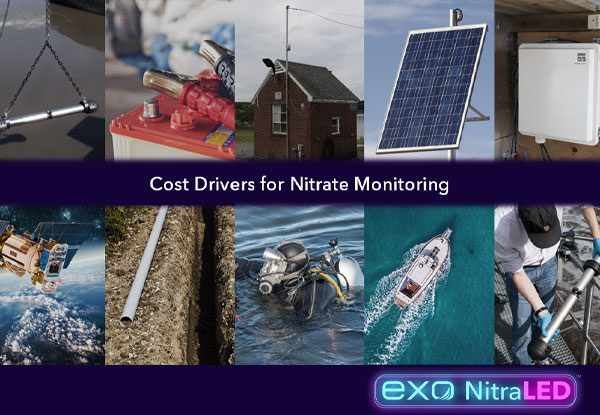
Nutrient monitoring is not cheap. There’s no doubt at all about that. Lamp-based Nitrate instruments currently available can cost nearly the same as a new car—or more! And other components also must be purchased to make these continuous monitoring instruments work.
Many of these systems run off of an external battery, which means you need a shelter to store it all in. Plus, you're going to need a solar panel and a regulator. Do you want to record and transmit that nitrate data? Well, you're going to need to add a data logger to your system. Oh, which means you'll also need to pay for that transmission service as well. And let's also not forget one of the most critical cost-drivers—the labor that goes into constructing a nitrate monitoring site. We're talking about digging trenches, feeding cables through conduit, burying that conduit—all of those necessary parts to protect your instrumentation. You might also have to pay a scuba diver, for example, to mount the nitrate sensor you’re deploying at the bottom of a lake or a deep river.
And speaking of going out on lakes like I just mentioned, you may need a boat—and someone to drive that boat. And you're going to need someone to service that equipment too.
I don't know about you, but my wallet feels a lot lighter just thinking about this.
And then to think, what about calibration and regular maintenance? How much will that run?
Lamp-based nitrate sensors are notoriously challenging to use when it comes to setup, calibration, and servicing. Do I calibrate the thing, or do I have to send it back to the factory? How do I know if the readings have drifted enough to warrant sending it in for factory service? These continuous monitoring systems for nitrate can be hard to clean, and their antifouling is often an afterthought. Will that mean I even need to budget and plan additional trips to the field site to clean it myself? Maybe the instrument even needs a perfectly level mounting platform or needs to be situated just so. Each sensor on the market has its own set of intricacies, making it a challenge to determine which sensor will work best for your nutrient monitoring project.
So, it's tough not to feel helpless with all of these challenges. Even for those environmental veterans who have monitored nutrients for years and have many experiences with that, everyone works hard to capture just a single data point. And while we always want continuous water quality data—how can we get there with these obstacles?
Brandon: Great question, Kerry. Unfortunately, as you demonstrated, monitoring budgets are getting smaller, and continuous monitoring for nitrate is expensive and challenging. But where there’s a will, there’s a way!
Lisa, why don’t you take it from here and discuss why the future is bright for continuous nitrate monitoring?
Lisa: Thanks, Brandon.
Let's talk about what the future of nutrient monitoring could look like!
What if continuous nutrient sensors were more widely available at a more affordable price point; if discrete samples were able to be replaced with continuous high-frequency monitoring with real-time output? And what if we were able to increase the accuracy and reduce the uncertainty of our nutrient load estimates?
What if we could collect more data? We know that data with low spatial and temporal resolution often yields results that are difficult to interpret and might not adequately support our management actions. So, what if we were able to replace all the discrete nitrate sampling with continuous real-time monitoring? So, much of our current understanding is based on our nutrient concentrations and loads based on traditional approaches, such as grab sampling. However, we know that this low temporal frequency approach needs to be added together with statistical methods and modeling.
Discrete sampling gives critical information on nutrient loads, but having this data in real-time and having continuous monitoring can help resource managers and policymakers identify specific causes of excessive nutrient levels and look at remediation options.
If we look at collecting nitrate data, as you’d expect, most organizations are only looking at grab samples right now. Here's an example chart of what that sampling program would look like and the nitrate data it would yield every week. Many of YSI customers might even sample on a just monthly basis, so we only see a snapshot in time.
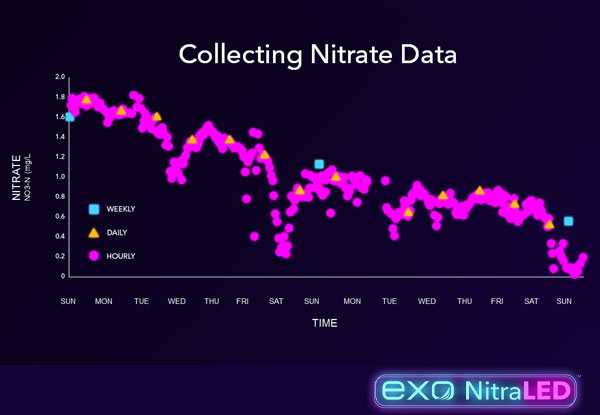
But if we increased the sampling rate and visited our field site daily, you can see that we're missing the range and fluctuations within our data. However, if we were to increase that rate even further and do continuous monitoring, sampling every hour, just look at the overall wealth of data that you're able to see and the fluctuations within. Capturing just a single broad sample is not indicative of what's occurring in the watershed.
More data is always better—but how could these continuous nutrient sensors help us tackle nutrient pollution?
Relying on grab samples leads to datasets with a low spatial and temporal resolution that are difficult to interpret. Instead, we could upscale our monitoring networks to collect high-frequency data with in-situ nitrate sensors. Combined with weather data and information on land management, that could help guide our implementation and evaluation of our BMPs or best management practices out in the field.
We know that tons of funding are spent implementing these best management practices each year to reduce nutrient loads and pollution in our watersheds. Having an expansive network of continuous nitrate sensors would allow us to guide and implement those and validate if they're working and what we could do better. It's also essential to have accurate and timely information on nutrient concentrations and loads to minimize our water quality impairment by managing the nutrient sources and their transport.
Improved nutrient load estimates and enhanced coastal monitoring are also needed to better understand the relationship between eutrophication and harmful algal blooms in our coastal waters. Can we prevent fish kills and dead zones, or at least shrink the affected area? Possibly, if we had more data! And that would lead to decreased socioeconomic impacts caused by HABs and hypoxia-induced fish kills.
Simply put, continuous data are critical to improving our overall water quality.
Also, looking at our drinking water intakes and drinking water facilities, if they use these real-time nitrate readings, they could take management actions to decrease the nitrate intake. Those actions could reduce the cost associated with the process of nitrate removal for potable water. If we're monitoring nitrate levels at the water intake, we can also decrease health risks associated with high nitrate levels in our drinking water.
Last, but not least, we're all environmentalists here, and our overall goal is to restore impaired water bodies, right? We want to get our aquatic ecosystems back to being sustainable, fishable, and swimmable. Continuous data can help fuel studies to find the best methods to reverse the effects of eutrophication and nutrient pollution.
You're here; I'm here; we're all here because we care about the environment. We’re stewards of our planet, and we have a real opportunity to right the ship. As a community, we have brilliant people ready to tackle nutrient pollution. We absolutely have the passion, but we've been missing accessible technology for collecting high-frequency nitrate data…until today.
Brandon: Yes, until today! So far, we've set the stage for our big technology reveal by reviewing the importance of monitoring for certain nutrients and the challenges with monitoring continuously at scale, specifically with nitrate.
But now it’s time to pass the presentation over to our EXO Product Manager, Zack Henderson. And, Zack, let’s share the exciting announcement!
Zack: Thank you, Brandon!
This is it—the moment you've been waiting for—the first look at YSI's latest sensor technology. And I'm very, very proud to introduce EXO NitraLED!
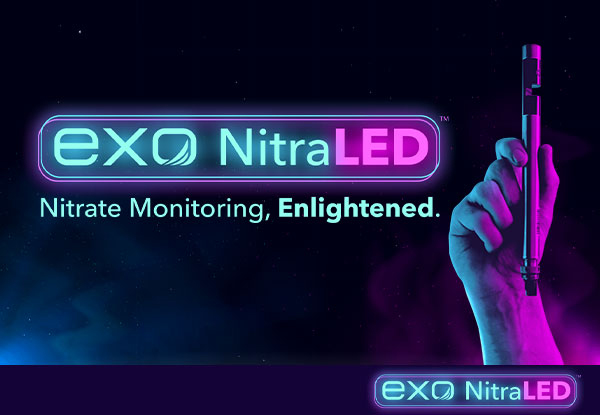
EXO NitraLED is the most accessible UV nitrate sensor in the world, built with novel LED technology for long-term nutrient monitoring! This game-changing smart sensor integrates seamlessly into YSI's EXO platform—and its affordable price point allows organizations to easily upgrade their water quality monitoring sites to collect continuous nitrate data.
Combined with an EXO Sonde, this sensor simplifies and dramatically reduces the cost of long-term unattended nutrient monitoring for point and nonpoint source pollution in freshwater environments. This is not a new sonde. Instead, this is a sensor designed to work with all existing EXO Sonde models, including EXO1, EXO2, and EXO3.
For those unfamiliar, EXO is our flagship water quality instrument and the industry-leading multiparameter sonde, with tens of thousands of systems deployed worldwide.
For nitrate monitoring, optical UV sensors carry the inherent advantages of being chemical-free and field-deployable. These types of sensors are well suited for in-situ monitoring as they remain stable for extended deployments. EXO NitraLED is purpose-built for outdoor freshwater monitoring and thus operates much more efficiently than existing UV sensors using xenon or deuterium lamps, which suffer from high power requirements and are bulky and expensive.
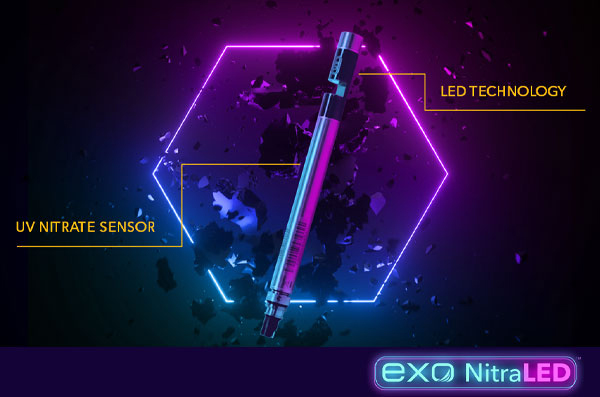
Recent advances in UV LED technology have enabled our Xylem engineers to miniaturize the light source, thus mitigating shortcomings associated with traditional lamp-based instruments commercially available in the past. Thanks to the truly innovative use of UV LEDs, YSI has been able to produce an optical nitrate sensor in a form-factor that fits in the palm of your hand. The small size enables the sensor to fit in existing EXO bulkheads without the need for any modification. All EXO probe guards and flow cells still work with EXO NitraLED.
What does this mean? It means you get nitrate monitoring with all the benefits of EXO. The EXO platform provides flexibility in deployment options, with a built-in battery compartment and onboard memory for long-term autonomous deployments.
Users can now monitor nitrate without the cost or burden of external hardware, such as power supplies and data loggers, which Kerry alluded to earlier. Additionally, EXO Sondes are a complete solution for water quality monitoring, featuring multiple sensor ports for measuring additional water quality parameters in the same instrument simultaneously.
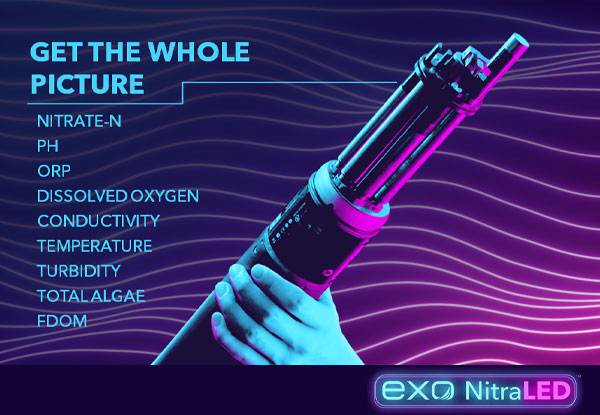
This enables a broader analysis of environmental conditions and impacts than just nitrate. EXO Sondes with NitraLED provide a more comprehensive understanding of water conditions, which leads to more informed decision-making.
And finally, the cost. We mentioned how expensive some of the existing, lamp-based solutions are for nitrate monitoring. Well, with a smaller form-factor comes a smaller price. You'll need to contact your local YSI representative for pricing information. Still, I can tell you our sensor is a fraction of the cost of other existing UV nitrate monitors on the market.
YSI launched the EXO Monitoring Platform in 2012, and it has continued to evolve ever since. We’re committed to expanding the platform, and EXO NitraLED is no doubt our most exciting development to date! Now, thousands of EXO monitoring sites around the world can be equipped with optical nitrate sensing.
With greater insight and earlier detection of increasing nitrate levels, environmental organizations can be more proactive in fighting eutrophication, harmful algal blooms, and hypoxia.
Brandon: Thank you for sharing that initial introduction to the EXO NitraLED sensor, Zack!
With new technology comes many questions on how things work, so let's spend some time discussing common questions people may have following our big announcement! Kerry, would you mind facilitating our Q&A session with Zack? (Visit YSI NitraLED FAQs).
Q&A
Kerry: Definitely! Zack, first things first, I'm very excited about the sensor, and it looks impressive. And I'm sure our audience is curious about how we managed to pull this off. So, what can you tell us about how the sensor works?
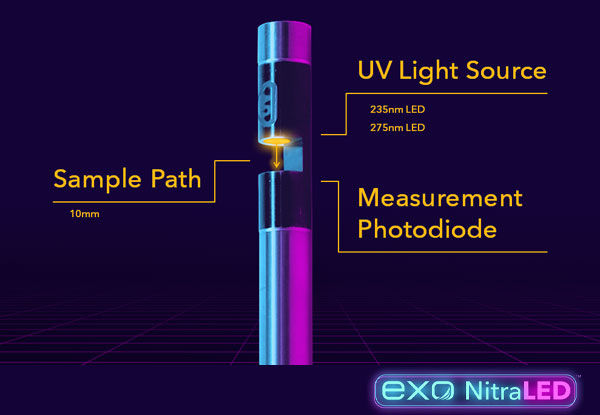
Zack: EXO NitraLED employs two UV LEDs as the light source, emitting light through a 10-millimeter sample-path to a UV enhanced photodiode. This measures nitrate absorbance while compensating for interferences from natural organic matter. The absorbance is proportional to the concentration of nitrate as nitrogen. Also, we use the EXO turbidity sensor for real-time turbidity compensation of the nitrate readings.
Kerry: What exactly are the advantages of the EXO NitraLED sensor compared to grab sample analysis like many organizations are doing right now?
Zack: The majority of monitoring groups use grab sample analysis, which is still very relevant and should not be replaced entirely. However, continuous, in-situ monitoring offers the benefit of more data, which provides greater insight into water conditions over hours and minutes, as opposed to days or weeks.
Briefly, let's take another look at this example from earlier. We have weekly grab samples over a three week period. It's difficult to discern what's going on, right? When we increase the frequency with daily samples, it becomes a little clearer that nitrate levels are trending; they're decreasing. But with continuous, hourly data, we reveal all the peaks and valleys, the environmental fluctuations that occur throughout each day, showing a more complete picture of the water conditions.
Kerry: So, that hourly data is probably coming from some type of continuous in-situ monitoring device, of course. How does NitraLED compare to other types of these sensors?
Zack: One typical sensor type for measuring nitrate is an ion-selective electrode. Ion-selective electrodes are not intended for long-term deployment applications. They're susceptible to significant sensor drift over short periods, whereas UV sensors, like NitraLED, remain relatively stable over long deployment periods in the field.
Both sensors are limited to freshwater environments, but EXO NitraLED is a better solution for long-term monitoring. It provides an improved minimum detection limit, greater accuracy, and much greater stability over lengthy deployments.
Compared to other UV nitrate sensors, EXO NitraLED is much more efficient using just a couple of LEDs to accomplish what a full lamp spectrophotometer can in a much smaller, less power-hungry, and more cost-effective package. Our sensor has less than 2% of the power requirements of traditional lamp-based systems. It’s MUCH more energy efficient and doesn’t require large, external batteries. It is powered by alkaline batteries in the EXO sonde, just like all the other EXO smart sensors.
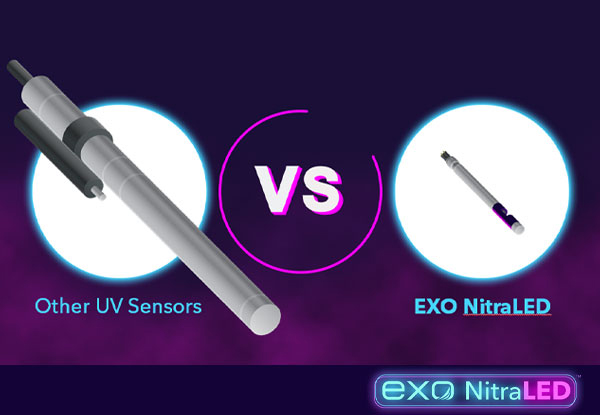
Kerry: If the scale from those images is correct, then it seems like the NitraLED sensor is much smaller than other equipment, making it a lot easier to take to the field. But what else do I need to get this installed at a monitoring site?
Zack: It is definitely smaller! It’s about 70x smaller than lamp-based alternatives and fits within the palm of your hand!
To monitor nitrate continuously, you'll need an EXO Sonde (A) and a turbidity (C), conductivity, and temperature sensor (D), which—as I mentioned earlier—is critical for real-time corrections for interferences. On an EXO2 and EXO3 sonde, you'll want a central wiper probe (E) to keep your sensor clean from debris and biofouling, just like with any other water quality sensor.
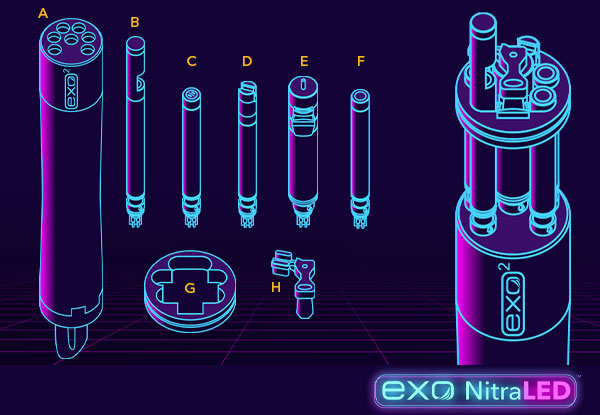
The EXO NitraLED sensor (B) is compatible with all other EXO sensors (F) and accessories. It fits within the standard probe guard and can also be used in flow cell applications. Along with those existing components, we are releasing two new accessories for EXO NitraLED. The first is a sensor alignment ring (G) designed to tightly hold the sensors and minimize any wiggle from the wiper cleaning the sensors. And speaking of the wiper, there is a new wiper brush (H) designed specifically with EXO NitraLED in mind. This brush installs on an existing central wiper and cleans all EXO sensors and the nitrate sensing window.
Kerry: That's all excellent information for getting the sensor setup on a sonde. But how else is EXO simplifying my water quality monitoring?
Zack: With long-term nitrate monitoring, there are many different ways to set up a monitoring station and manage your data. At its most basic level, you only need an EXO sonde. With the reduced power consumption of the NitraLED sensor, it can run off the sonde’s internal batteries like all other EXO sensors.
An EXO sonde includes built-in memory for internal logging, which allows for simple, autonomous deployments without the cost or burden of external hardware, like a datalogger. If you want to add nitrate monitoring to your existing field station, and you already have an EXO Sonde installed, plug the sensor in, and you're ready to go. No new infrastructure is required and no more digging trenches, Kerry.
Kerry: That sounds fantastic. So, once I have this sensor installed, how exactly do I calibrate it?
Zack: First of all, I'd like to point out that not all UV nitrate monitors allow for user calibrations. In many cases, traditional, lamp-based nitrate sensors often require incredibly expensive factory calibrations. You have to pull those instruments from the field and ship them to the manufacturer for service, which can be a major inconvenience!
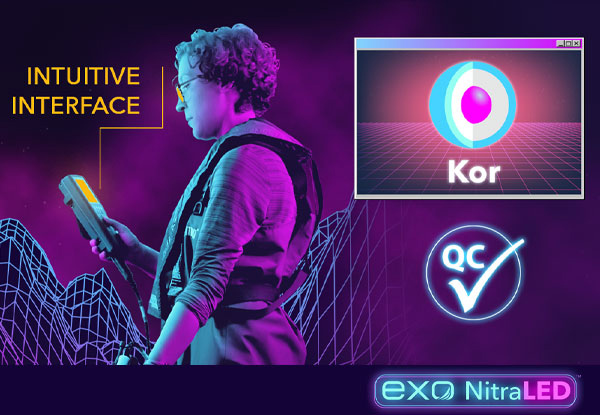
EXO NitraLED gives users the ability to perform their own calibrate when needed. Now, this process is similar to any other two-point calibration of an EXO sensor. Our Kor Software will guide you through with stability indicators and tips. And a calibration report will be generated at the end to save for your record keeping.
Kerry: In your product introduction, you mentioned the sensor corrects for NOM and turbidity interferences. Can you talk a little bit more about the site-specific correction and how the NitraLED sensor corrects for those?
Zack: Sure thing! In addition to standard sensor calibration, Kor Software allows users to perform a site-specific correction for turbidity and natural organic matter or NOM. Not all turbidity and NOM are created equal, so site-specific corrections may yield better results than the default corrections pre-programmed in each NitraLED sensor.
By comparing absorbance between raw and filtered samples collected from the deployment site, this process fine-tunes the sensor to compensate for specific interferences present at that site.
Kerry: We've talked about physically installing the sensor into an EXO sonde. But how easy is it to set up the sensor in the software? Will there be any helpful tutorial videos to help me get started?
Zack: The great thing about NitraLED is that it’s just like any other EXO sensor and uses the same software. You don't have to learn a new interface. And if you're new to EXO, Kor software is a simple interface for efficient setup and operation. It also features a built-in quality assurance system called SmartQC, which displays your sensors' health and provides peace of mind for deployments. Additionally, we'll be releasing new EXO University training videos that walk through the site correction process, the calibration, and the installation of the sensor, alignment ring, and the new wiper brush.
Kerry: So, you have mentioned this upgraded wiper brush several times now, Zack. Can you speak more about how the sensor is protected from biofouling using that wiper brush?
Zack: EXO NitraLED is compatible with the same great central wiper on EXO that protects all the sensors from fouling and ensures data integrity over long deployment intervals. The new brush accessory features a unique arm extension with a dual bristle design. This means it can wipes smoothly through the NitraLED sensing window, keeping the sample path clean and reducing the number of trips to the field, thus reducing the cost of monitoring.
Kerry: Normally, innovative technology is a lot more expensive than technology currently on the market, but it appears this sensor is very cost-effective compared to existing alternatives. Why is that?
Zack: Most other UV nitrate sensor manufacturers have taken a laboratory spectrophotometer and retrofitted it for use in the field. And with that, you see the increased prices. Our sensor has been designed from the ground up for field monitoring, not ‘frankensteined’ from previous technology.
We've developed a much more efficient, purpose-built sensor. As mentioned earlier, the use of UV LEDs rather than a full lamp enables us to save on cost, which allows us to lower the price point. Furthermore, we're trying to meet the increasing need for lower cost, higher volume nitrate monitoring solutions that still produce accurate and reliable data.
Kerry: We've talked a lot about the NitraLED sensor for pretty obvious reasons, and we've also touched on the EXO platform. Is there any additional information that our audience should be aware of?
Zack: Of course! There are many other benefits of the EXO platform that we don't have enough time to get into, but I'll briefly hit on some highlights related to long-term nitrate monitoring.
EXO has a powerful feature called adaptive logging. This feature allows the nitrate data you collect to trigger changes in overall sampling intervals. Let me give you an example!
If a specific parameter you're monitoring breaches a user-defined threshold—aka an event occurs, perhaps point-source pollution—then EXO can begin collecting data at a much faster rate to capture the event.
In addition to the adaptive logging capabilities, EXO simply has the best antifouling wiper in the industry, ensuring consistent data even in high fouling environments. The software has user calibration with that built-in SmartQC quality control, ensuring the sensors are always in good working order. Additionally, the software allows for data export and a CSV file for easy integration into other data management platforms.
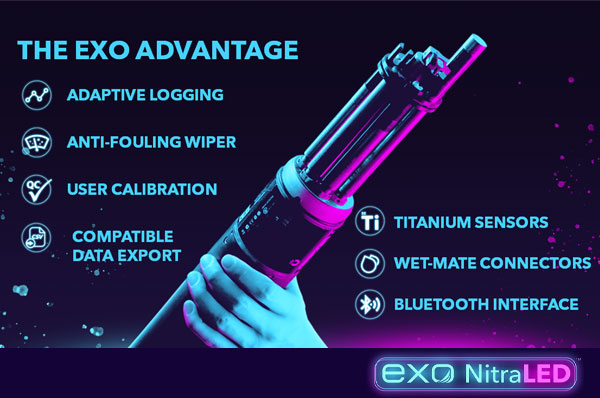
EXO sensors are also extremely rugged, titanium-sealed with wet-mate connectors. And finally, EXOs all feature Bluetooth connectivity for a wireless interface, which is excellent for calibration. So you don't have some cable knocking over beakers or calibration solutions.
With increasing cases of eutrophication, harmful algal blooms, and hypoxia, there is greater demand for nutrient monitoring over large geographic areas. And with EXO NitraLED, you can have cost-effective nitrate monitoring practically anywhere you have an EXO sonde.
Brandon: I think the other question that’s on everyone’s mind is…when will EXO NitraLED be available? …And the answer is right now!
Request a quote on our latest EXO Sensor and learn more about how it could revolutionize your monitoring program. Visit YSI.com/NitraLED for more information!
Have more questions about EXO NitraLED? Ask our experts—or check out our FAQ page!
Thanks for watching, and have a great day!
[3] Diaz, R., Selman, M., Chique, C., 2010. Global Eutrophic and Hypoxic Coastal Systems. Eutrophication and Hypoxia: Nutrient Pollution in Coastal Waters. World Resources Institute http://www.wri.org/project/eutrophication
[6] Weatherly, J. “Algal bloom cost Mississippi Coast tourism $4.1 million in June, July.” Mississippi Business Journal. 23 October 2019.
[7] Wolf, D & Klaiber, HA. “Bloom and bust: Toxic algae’s impact on nearby property values.”
Ecological Economics, vol 135, May 2017, pp 209-221