Networks That Work: Narragansett Bay Fixed-Site Water Quality Monitoring Network
(Updated February 2026)
Narragansett Bay’s Watershed Moment
As New England’s largest estuary, Narragansett Bay covers 150 square miles and its adjacent watershed encompasses ~2000 square miles of Massachusetts and Rhode Island, an area called home by more than two million people.[1] The Bay’s beaches and piers attract millions of tourists each year. Adjacent tourism reaches deep into each state with natural treasures like the Seekonk and Providence Rivers in Rhode Island, and the Taunton River in Massachusetts. The Bay’s 25 km mouth spanning from Sakonnet Point to Point Judith spills southward into Rhode Island Sound where it flows onto the Atlantic Ocean (Figure 1).
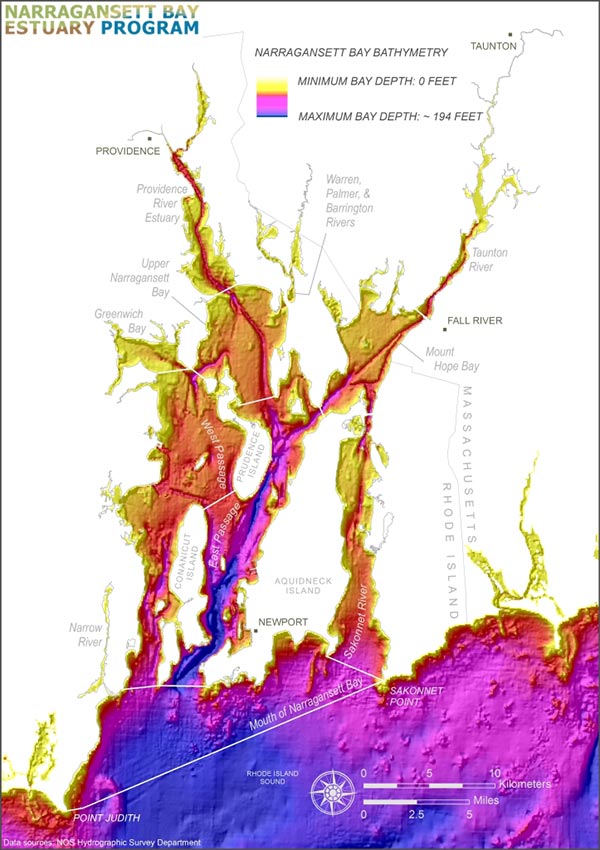
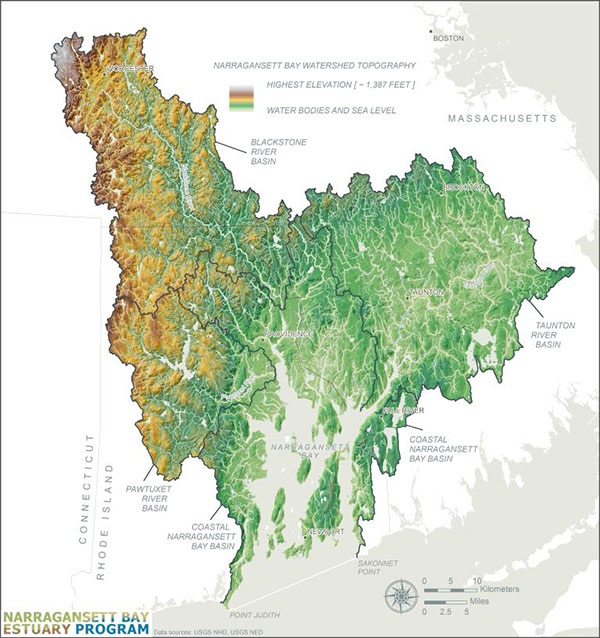
Figure 1. Bathymetric (top) and topographical (bottom) maps of Narragansett Bay. Used with permission from the Narragansett Bay Estuary Program.
The Bay as we know it today is not at all like the pristine sanctuary encountered by European settlers who arrived in the 17th and 18th centuries, or the one enjoyed by wealthy aristocrats who flocked to the area for summer holidays throughout the 19th century. By the early 20th century historical records reflect significant damage to Narragansett Bay as a consequence of both a booming population and the industrial revolution.
A turning point appears to have come with the installation of pumps that could move water from the Bay to shore for use by farmers and the city of Providence in 1871, and which enabled animal and human waste that had previously stayed on land to be flushed back out to the Bay. This nutrient-rich runoff was not the only problem: jewelry manufacturing was a staple of Rhode Island’s economy for about 200 years, until its decline in the 1970s, and a booming textile industry also formed. Prior to the Clean Water Act of 1972, the heavy-metal-laden discharges from these businesses were unrecognized and unregulated, and benthic sediments still bear the scars of heavy metal contamination from this period.[2]
Declining water quality and ecological shifts had redefined life for Narragansett Bay’s plants, wildlife, and humans, and were top of mind in 1987 when the United States Congress deemed Narragansett Bay an “Estuary of National Significance.” This designation derived from the Clean Water Act, with the formation of the National Estuary Program (NEP) under the purview of the Environmental Protection Agency. The Narragansett Bay Estuary Program (NBEP) was one of the first in the NEP.[3]
Meanwhile, the Coastal Zone Management Act (CZMA) of 1972 had established estuarine sanctuaries that were managed by the National Oceanic and Atmospheric Administration (NOAA), and in the 1988 reauthorization of CZMA the 29 sanctuaries were renamed the National Estuarine Research Reserves (NERRs). These included a reserve on Narragansett Bay. The NEP and the Narragansett Bay NERR (NB NERR) worked with the states of Rhode Island and Massachusetts on a number of water quality research projects throughout the late 1980s and 1990s, often in collaboration with each state’s academic institutions and municipalities.
In April 2000 a report published by the Rhode Island Department of Environmental Management (RIDEM), NEP and NBNERR collated data from multiple disparate sources to summarize the status of water quality in Narragansett Bay.[4] An important observation at that time was that monitoring had enabled RIDEM to see where specific actions had led to positive outcomes.
For example, a study by Desbonnet and Lee (1991) had compiled data from 1953 into the late 1980s and showed that biological oxygen demand (BOD) had steadily increased up until the early 1970s, when a dramatic reduction took place. The reductions were directly attributed to secondary treatment upgrades made by wastewater facilities aiming to comply with the 1972 Clean Water Act. Additional data added by RIDEM confirmed that into the late 1990s facilities had achieved 90-97% removal of BOD in their discharges (Figure 2)!
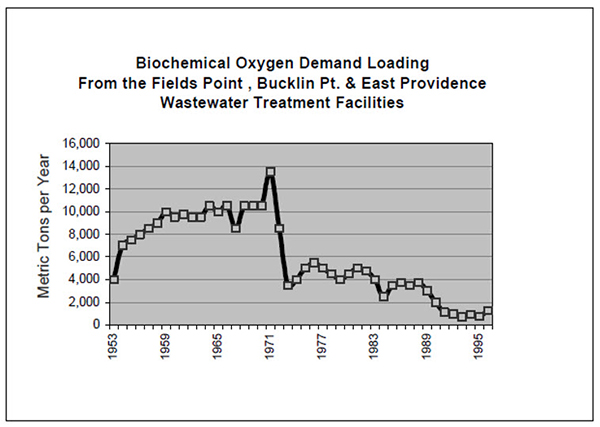
Figure 2. BOD monitoring at sites downstream of wastewater treatment facilities whose discharges impacted Narragansett Bay. Graph is from RIDEM’s April 2000 report.4
It was three years after that key report, however, that Narragansett Bay experienced its Watershed Moment.
On August 20, 2003 about 1 million fish, mostly juvenile menhaden or bait fish, perished in Greenwich Bay near Providence, Rhode Island (Figure 3). The carnage wasn’t limited to fish: prized blue crabs, grass shrimp, blackfish and American eels were also affected, soon to be followed by soft-shell crabs in another event a week later.[5] This was a turning point in the region’s ongoing battle with pollution from sewage and septic systems, which had fueled a massive hypoxic event that led to the disaster.
Hypoxia is a condition where the concentration of dissolved oxygen (DO) decreases to a level that can no longer support aquatic life. Though it varies slightly from saltwater to freshwater, and other water quality conditions can play a role, it is generally accepted that 5 mg/L (50% saturation) is the lower DO limit for most fish, and < 2 mg/L is toxic to almost all aquatic life, excepting some microbes. Depending upon their management priorities, different states, or even countries, have different acceptance limits for DO in their waterways.
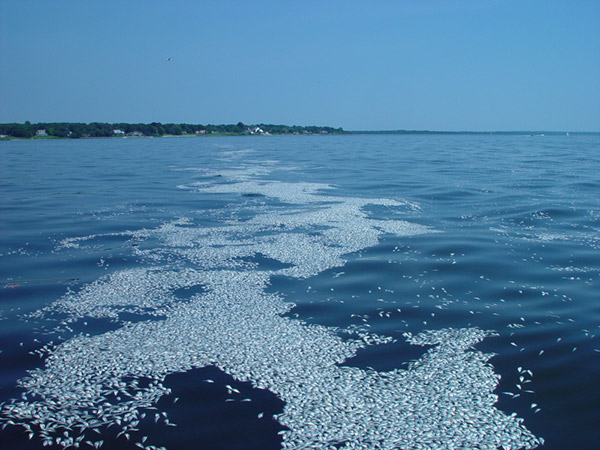
Figure 3. A fish kill in August 2003 due to severe hypoxia in Greenwich Bay, near Narragansett Bay, RI. Photo by Chris Deacutis.[6]
The 2003 event did not come as a surprise to environmentalists in the area, who had been raising alarms about numerous sources of pollution in the Bay, all of which could impact oxygen levels and marine life. It was already known that nutrient-rich inputs played a role in hypoxia, including drastic events like one that occurred in 1999, when a single 30 hour period saw DO levels starting at 9.7 mg/L plummet to less than 1 mg/L. This prompted the states of Rhode Island and Massachusetts to implement regular DO monitoring (along with temperature and conductivity).[7]
Narragansett Bay’s 2003 Watershed Moment converged with the clear evidence that water quality data could support impactful decision making, and was the catalyst for the formation of the Narragansett Bay Fixed Site Monitoring Network (NBFSMN).
Let’s look at how this network works.
The Narragansett Bay Fixed Site Monitoring Network
Ten years after its Watershed Moment, by 2013 water quality in Narragansett Bay had greatly improved. The hypoxic conditions which suffocated Greenwich Bay’s fish were far better understood and steps to manage hypoxia had been taken. There was an appreciation that even further improvements could be made with strategic investments since fish kills did still occasionally occur.[8]
A major contributor to the ten-year turnaround is believed to be the NBFSMN, which helped stakeholders to understand the dynamics of hypoxia in the Bay and provided key information to managers. The NBFSMN includes several partners, who tend to water quality monitoring stations and/or contribute in other vital ways:
The NBFSMN today consists of 15 sites, the majority of which are buoys equipped with water quality sondes (Figure 4). The stations generally operate May through October, when algae blooms and hypoxia, still a threat for Narragansett Bay, are a greater risk. The 8 sites owned by RIDEM, 2 by MassDEP and one by URI-GSO are all operated by URI/GSO. NBC owns and operates two sites downstream of their wastewater treatment plants. The Phillipsdale monitoring station is downstream of the Bucklin Point facility in the Seekonk River (F4 in Figure 4), and the Bullock's Reach station is in the Providence River downstream of the Field's Point facility (B4 in Figure 4). The NBNERR operates one site (F4 in Figure 4), and had earlier versions of the protocols that informed the NBFSMN Quality Assurance Program Plan (QAPP).
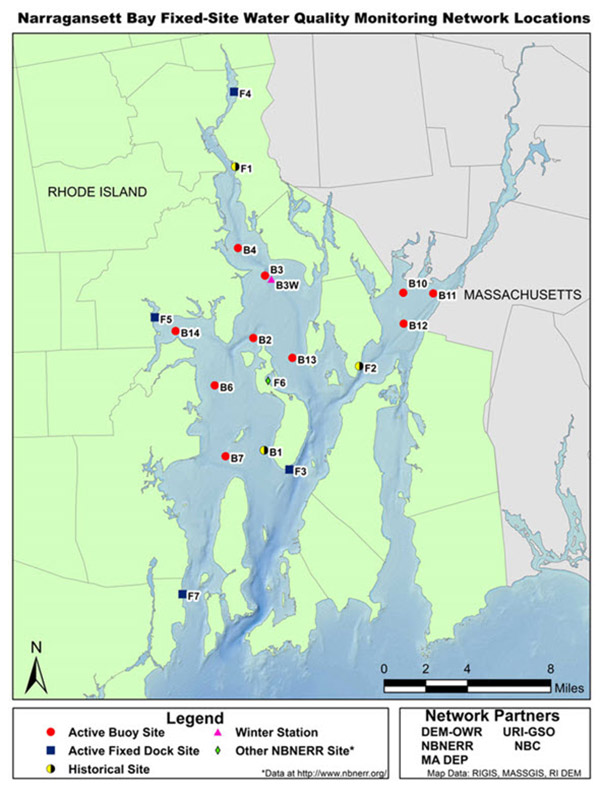
Figure 4. Map of the monitoring sites in the NBFSMN, provided online by RIDEM.[9]
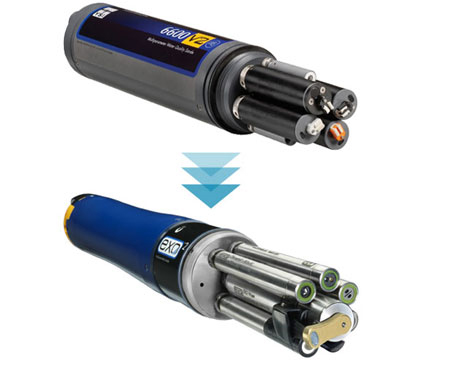
Originally YSI 6-series sondes bearing sensors for depth, temperature, conductivity (used to report salinity), chlorophyll, DO, and pH were used at most sites. Today, these are largely changed over to YSI’s EXO platform, with sensors to cover the same parameters. The buoys are also equipped with dataloggers and cellular-based telemetry to provide site operators with real-time data display capabilities.

An interesting feature of some of the sites is that two sondes are used to simultaneously monitor at two different depths. Stratification can occur where freshwaters and saltwaters combine, as they do where rivers enter a coastal bay like Narragansett. Water density is affected by both salinity and temperature, which also affects currents and water movement. Warm and fresh waters are less dense than cold and salty waters.
Stratification alone is of great interest to marine scientists, but in Narragansett Bay it is of particular relevance because of the ongoing struggle with hypoxia. Salinity gradients often drive oxygen gradients, and those colder, saltier, deeper depths are often where the signs of hypoxia first show up and persist. This can often happen, for example, when an algae bloom dies off, and the dead algal biomass is consumed by bottom-dwelling microbes that consume oxygen in the process (called heterotrophic bacteria). These types of conditions still lead to fish kills in Narragansett Bay today.[10]
The ongoing streaming of temperature, salinity (derived from conductivity), DO and pH data to NBFSMN scientists makes it possible for all data to be made publicly available at some of the partners’ websites, as well as RIDEM’s website. The public can grab the Weekly Water Quality Reports that the team publishes to always be up to speed on how the Bay is faring. In addition, annual water quality data reports (including QA/QCd data) are archived and publicly accessible through the NBFSMN's lead agency, RIDEM, website.
But how do the public stakeholders and scientific collaborators know that the data collected by all of these different partners is comparable? Are some sites more trusted than others? It’s no secret that two entities using the same equipment to do the same thing might get different results. How do we know that the data from the NBFSMN are good data?
For those answers we turned to Heather Stoffel of URI-GRO, so that we can understand one of the most important functions of a Network that Works: Quality Assurance and Quality Control (QA/QC).
QA/QC at the NBFSMN
Stoffel has been with the NBFSMN since it started and has years of field experience running monitoring stations and training students and other researchers in the maintenance and operation of the stations. When asked what makes the Narragansett Bay Network work, she identified two things that distinguish it from less successful or now-defunct networks.
- The NBFSMN quality-controlled data are available publicly to a broad number of people and utilized for many types of projects, ranging from URI research projects to regulatory permitting, and
- The NBFSMN provides a unique, long-term perspective that allows the entire team and its stakeholders to evaluate the impacts of state programs and other practices that have been implemented.
A Research Associate II at the URI-GSO, Stoffel is also the Quality Assurance Officer for the NBFSMN, so she is the focal point for making sure that quality-controlled data are delivered to decision-makers, and that the distinctions she pointed out above remain intact.
The foundation for data quality is built with the technology, and all of the buoy stations of the NBFSMN have employed YSI sondes since the beginning. RIDEM still have some YSI 6600 sondes that they used since the earlier days of the network (the early 2000s) and starting around 2015 the transition to the EXO platform began. Having good technology is a great place to start, but ensuring data quality has many layers beyond the technology.
Consider for example the ongoing stream of live data to the NBC’s “Snapshot” website. Those data are the raw data, which is different than the data that ultimately are used for reporting. While there is valuable information in the raw data that can speak to conditions of the instruments themselves, almost without fail scientists and regulators will prefer to use the QA/QC-governed data generated by Stoffel.
As described by Stoffel and also outlined by RIDEM-OWR, there are multiple criteria for processing data in accordance with the NBFSMN’s Quality Assurance Project Plan (QAPP).[11] Raw data comes straight from the instruments and may be processed into “edited” files where specific data validation criteria have been applied to remove invalid data points, such as statistical outliers or non-data error codes. The edited files may then be “corrected,” where missing points are calculated using specific criteria to generate a more complete data set. Some of the data in both edited and corrected files may also be available as graphs that can be used directly for reports or papers. Finally, there are metadata that outline how the edited or corrected data were processed, and which also includes additional information like calibration records, operators, etc.
According to Stoffel, at the end of each year, “All network partners send me the data and I root out the data that is suspect, and do the corrections. So we provide the three types of data, raw, edited and corrected, along with the metadata.”
All types of data are used. Weekly water quality reports available at RIDEM, due to the frequency of the posts, are based on raw data, just like the NBC’s Snapshot. Raw data, even which pre-date the NBFSMN, are available online.[12] Fully corrected data form the basis for some of the most important reports generated by the program, such as 2017’s State of Narragansett Bay and Its Watershed, available as a summary and a full technical report through the NBEP.[13]
This 500-page report has the corrected data from the NBFSMN on full display, especially in chapters that are devoted to specific parameters like DO (Chapter 15) and chlorophyll (Chapter 16). An excerpt of the data (Table 1) barely does justice to the volumes of data the Technical Report has to offer, but shows the importance of the quality of the data when trying to draw conclusions and assess impacts.
The DO data show that the Bay continues to experience hypoxia, defined by the program as < 2.9 mg/L. This threshold is definied by RIDEM's water quality criteria for dissolved oxygen in saltwaters. Among the areas of the Bay that are monitored for DO, the Seekonk and Providence Rivers, where the NBC’s buoys are found, struggle the most to stay above the 2.9 mg/L threshold. The average DO for 2015 and for the decade of 2005-2015 barely hovers above 2.9 mg/L, and the minimum values recorded were well below it.[14]
Figures 7 and 8 in Chapter 15 show that the error bars on these measurements are considerable, which could be due to a number of factors. For example, the fluctuations in salinity and mixing that occur with the tides and weather events are a factor.
It is anticipated that climate change, and climate-induced fluctuations in water temperatures, will add further complexity to DO measurements in the future. It is important to note that these environmental conditions are the primary drivers of the sizes of the standard deviations. YSI’s instrumentation along with calibration records and a solid QAPP minimize the contribution of the sensors to measurement error, though that contribution is never zero.
| Year |
Average |
Minimum |
| 2015 |
3.6 |
2.1 |
| 2005-2015 |
3.4 |
0.9 |
Table 1. Summary of the average and minimum DO for 2015 compared to the 10 year average for 2005-2015 for the Seekonk and Providence Rivers. Values are in mg/L.
In the end, the data support what is observed in the system. Low DO still manifests itself as an occasional fish kill in these Rivers, though not as frequently on the same scale of the 2003 event described earlier.
The Future of the NBFSMN
The NBNEP 2017 technical report reaches a number of primary conclusions, and one of the most relevant for the NBFSMN is this:
“More research and monitoring are needed to understand the rapid, major changes occurring in the Bay and Watershed in order to enable well-informed adaptation and mitigation.”[15]
This conclusion is not just a shameless plea for ongoing funding by the network-engaged authors. The report points to definite data gaps that will require new technologies going forward, and the growing influence of climate change. For instance, while CSO abatement has reduced pathogen loading into the Bay, stormwater has now emerged as an “increasingly problematic source of pollution.” What is the future, then, for the baseline water quality monitoring in Narragansett Bay, which alone cannot fill all of these data gaps? Will it decline, replaced by new monitoring needs?
It seems unlikely, because as the authors point out, water quality parameters will always be key indicators of the stressors faced by aquatic life and the ecosystem overall. Further, while a lot of the problems that led to the formulation of the NBFSMN are better understood and even, in the case of CSOs, better managed, the old problem of hypoxia still persists.
YSI is proud to provide the instrumentation for this program and like the NBFSMN itself, we plan to be around for many years to come so that we can continue to support this network that works.
Special thanks to Heather Stoffel for her assistance in writing this blog, as well as for her great work she does with the NBFSMN.
[10] Codiga et al. 2009. Narragansett Bay Hypoxic Event Characteristics Based on Fixed-Site Monitoring Network Time Series: Intermittency, Geographic Distribution, Spatial Synchronicity, and Interannual Variability. Estuaries and Coasts 32:621-641.