Making The Connection
This is a brief overview of connecting the EXO2 water quality monitoring sonde and the Storm 3 data logger for remote monitoring at your site. 
1. Connect to Sonde Using KorEXO Software
Using the USB cable or Bluetooth, connect your EXO Sonde to a PC or Laptop running the most current version of KorEXO software. If you are making a wired connection to the sonde, open KorEXO and press the ‘Connect’ button under your sonde in the Instrument Connection Panel. If you are making a Bluetooth connection press the ‘Scan for Bluetooth Devices’ button. Once KorEXO finds your sonde press the connect button. See Figure 1.
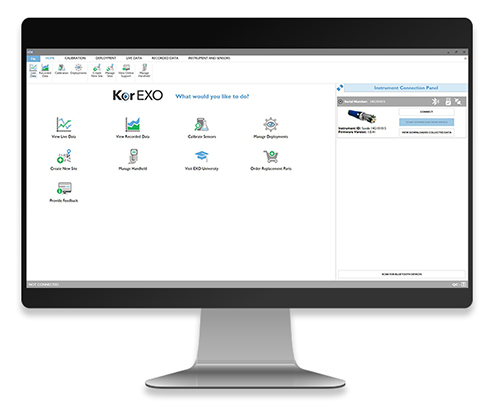
Figure 1: Connect Sonde using KorEXO software
2. Open Up and Rename Deployment Template
You will need to set the sonde up for your deployment. To do this, first click on ‘Deployment’ at the top of the screen. You can now select to create a new template, edit the template on the sonde or edit a template on your PC. Once you have selected the template you want to edit, set the template name and the logging interval (if you are going to internally log data on the sonde) in the Basic Deployment Settings. See Figure 2.
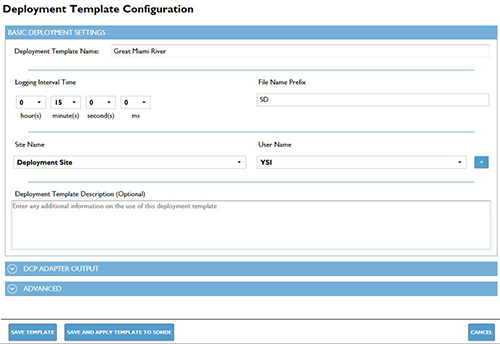
Figure 2: Name the template and set the logging interval in the Basic Deployment Settings
3. Setup SDI-12 Output of the Sonde
The DCP Adapter Output section allows you to set the SDI-12 address for your sonde. Select a unique address from any other sensors that will be connected to your data logger. See Figure 3. The two columns below dictate what parameters get output to the data logger.
Select parameters that you are interested in outputting from the ‘Available SDI-12 Parameters’ column, and use the arrow or double click on the parameter to add them to the ‘Selected SDI-12 Parameters’ column. The up and down arrows control the order in which they will appear.
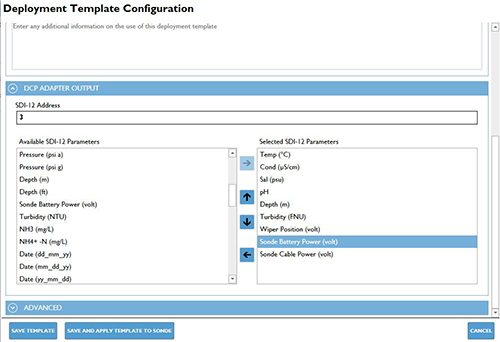
Figure 3: Setup SDI-12 output
4. Setup Advanced Options
Most applications will not require any changes to the Advanced setup but there is one main setting here we want to look at—the logging mode. If you are going to send the data to just the Storm 3 and do not plan to do any internal logging, then it does not matter what this is set to. However, if you would like to log the data internally to the sonde, as well as send it to the Storm 3, the logging mode should be set to ‘Sample and Hold’ (See Figure 4). This will allow the sonde to run and log data based off of its own internal logging interval. When the sonde gets a measure command from the Storm 3, instead of taking a new measurement, it will now respond with the latest internally logged value. This ensures that the internally logged data will match the data sent to the Storm 3.
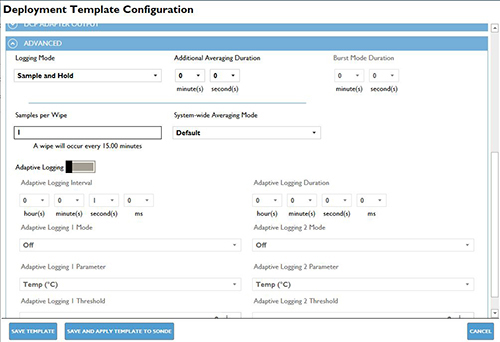
Figure 4: Select ‘Sample and Hold’ in the Logging Mode
5. Save Template and Send to the Sonde
Now that the template is set up, we need to send it to the sonde. Press the ‘Save and Apply Template to Sonde’ button. This will save the template to your PC and push it down to the sonde. You will then be asked if you would like to start internal logging on the sonde. If you would like to log data internally press ‘Yes’. If you are not going to log data internally, select ‘No’. If you select ‘Yes’, you will be given the option to select when the logging with start. The options are: Now, Next Interval or Custom. Select your preferred start time and press the ‘Start’ button. It is not uncommon for users to use the logging in the sonde for added redundancy, in case lightning, vandalism, or some other incident incapacitates the Storm 3 unit.
6. Disconnect Sonde from Computer
You can now disconnect your sonde from the PC by pressing the ‘Home’ button, and then ‘Disconnect’ on the Instrument Connection Panel. If you are using the USB signal output adapter you can disconnect.
7. Connect Flying Lead Cable
Make sure that the communications connector on the top of the sonde is clean and properly 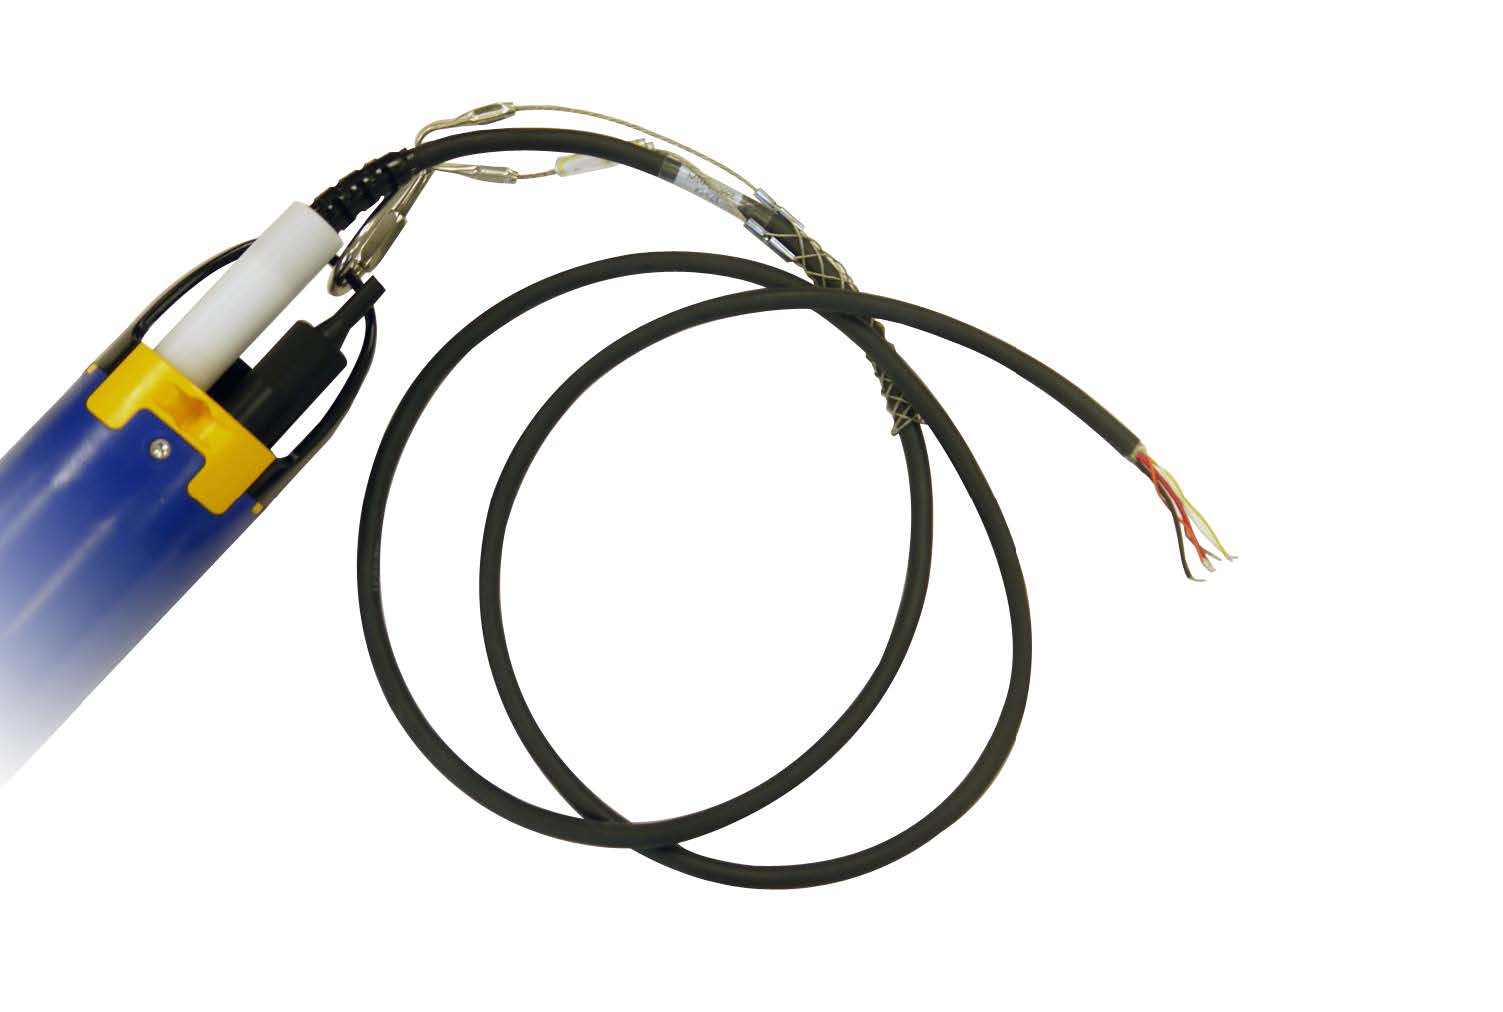 lubricated using the Krytox grease supplied with your EXO sonde. Attach the flying lead cable to the sonde with the white collar, and the strain relief to the bail on the sonde. See Figure 5.
Figure 5: EXO2 with flying lead cable attached
8. Wire DCP Adaptor to EXO2 Sonde
On the right hand side of the adaptor, connect the bare wires from the flying lead cable. Match the wire colors to the labels on the adapter (See Figure 6). The orange wire on the flying lead cable is not used.
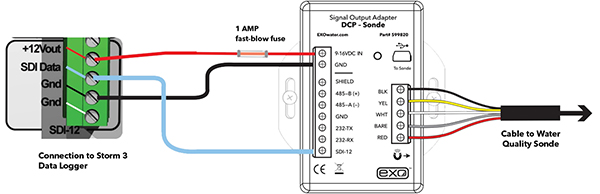
Figure 6: DCP adaptor wiring diagram
9. Wire DCP Adaptor to Storm 3 Data Logger
Take the 3-wires from the DCP Signal Output Adaptor and bring them over to the SDI-12 section on the Storm 3 data logger (Figure 6). Hook the +9-16VDC IN from the DCP-SOA to the +12V out port, the SDI-12 wire to the SDI Data port, and the GND wire to the ground (Gnd) port.
10. Power Storm 3
Connect the positive terminal from your 12V battery or other 12VDC power source to the +12V power port in the Power section on the Storm3. Connect the ground to the Gnd terminal on the Power section of the Storm 3. Next we need an earth-ground connection tied to the central location of the system and either the gauge house or a grounding rod.
11. Connect to the Storm 3 Via Web Browser
Plug in the Wi-Fi USB adaptor to one of the two USB ports on the Storm 3 data logger (See Figure 7). If the adapter is already plugged in press the Wi-Fi button on the front of the Storm3 to activate the Wi-Fi signal. You’ll start to see the active light blinking on the data logger, and a blue light on the Wi-Fi adaptor. Once the blue light on the Wi-Fi adaptor is blinking, look for the Storm broadcast signal under the Wi-Fi settings on your device (phone, tablet, etc.).
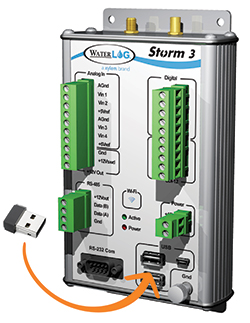
Figure 7: Insert Wi-Fi adaptor
After you’ve connected to the Storm 3, bring up a web browser and the Storm 3 home screen Graphical User Interface (GUI) will appear. If the Storm 3 home page does not automatically load, navigate to the address: 172.20.20.20.
12. Set Up Your Site
In the Home tab of the Storm 3 GUI, click on ‘System Overview’ submenu in the pane on the left side of the screen. From here you can set the Site ID, Date, and Time for your location (See Figure 8).
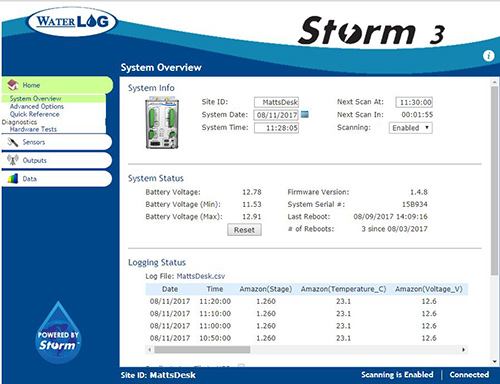
Figure 8: Set up your site
13. Select Sensor in the Storm 3 GUI Sensor Library
Under the Sensors tab on the left pane of the Storm 3GUI menu, select the ‘Add New Sensor’ submenu. From here, select the ‘Manufacturer’ option and scroll down to YSI. Scroll through the library to select the exact sensor you are going to use—in this case, the EXO2 sonde.
14. Verify Sensor Settings
After selecting the sensor from the library, the Storm 3 GUI will automatically go to the sensor setup page (See Figure 9). Verify that the SDI-12 address shown here is the same as the SDI-12 address for the sonde. Once verified, press the refresh button to instruct the Storm 3 to find the available parameters selected by the sonde. Scroll down to ‘Schedule’ to set the scan rate and scan order (if you have multiple sensors).
Figure 9: Sensor setup page of Storm 3 GUI
15. Verify Parameter Settings
On the left hand side of the screen, there will now be parameters displayed under the defined sensors (See Figure 10). Select a parameter to verify its settings. Scroll down to ‘Outputs’ to select what to do with the data. ‘Log file’ is always on by default, but the option for Storm Central, GOES or Modbus must be selected manually.
Figure 10: Verify parameter settings
If you would like to have the data sent to Storm Central via the built in cellular modem (if equipped) put a check mark in the Storm Central box (see Storm Central user guide for detailed instructions to setup your Storm 3 to transmit to Storm Central). If you are using a GOES transmitter you can put a check in the GOES Self-Timed or GOES Random boxes. The sensors are now setup.
From the Home tab screen, enable scanning and disconnect from the Storm 3. You are now ready to
collect live data at the monitoring site.