Great Lakes Fisheries Management
Lake Erie is the shallowest, warmest, and most productive of the Great Lakes. Lake Erie is bordered by four states and the province of Ontario, with over 6 million surface acres and nearly 800 miles of shoreline. Fishing, both commercial and recreational, is big business on Lake Erie. Economic benefits are estimated in the hundreds of millions range for sportfishing alone.
Maintaining Healthy Fish Stocks
It is important to maintain a healthy ecosystem with sustainable fish stocks, most importantly the highly sought after members of the perch family, walleye and yellow perch. Lake Erie experienced significant water quality improvements through the 1970’s and 1980’s, mostly due to the Clean Water Act. Unfortunately, the frequency of harmful algal blooms is once again increasing, so the need to monitor water quality and its impact on the food web has never been more important.
Great Lakes biologists routinely monitor fish stocks by conducting trawl surveys and lower trophic level surveys on Lake Erie. Trawl surveys are completed monthly in the western basin from May through September, while the lower trophic level surveys are completed every two weeks during the same time period.
Need for Reliable Data
When conducting trawl surveys and lower trophic level surveys, it is critically important to have an accurate water quality profile at each site. In addition to providing accurate measurements, data management is also important, as is the ability to confirm via GPS that data is collected at the same site each and every time the survey is conducted.


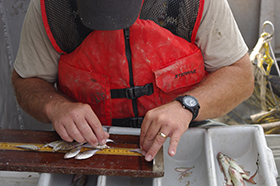
A Great Lakes Fisheries Biologist measures and separates fish caught during a survey on Lake Erie.
In order to address these challenges, a Great Lakes Fisheries Biologist recently acquired the YSI ProDSS (Digital Sampling System). “For both surveys we need an instrument that collects multiple water quality parameters that is capable of logging data at each of our sites. The ProDSS is very convenient because of its size and how simple it is to operate. We are able to set up our sites in the unit’s memory ahead of time and then simply log data to each site when we are in the boat. The additional GPS sensor confirms exactly where the data were collected.”
Lake Erie Trawl Survey
In addition to GPS, the depth and optical dissolved oxygen sensors on the ProDSS prove especially helpful. “Our trawl survey is used to index the abundance of young-of-year walleye and yellow perch, along with numerous forage species in Lake Erie’s western basin. Trawling occurs at the bottom of the lake in depths from 15 feet to over 40 feet.
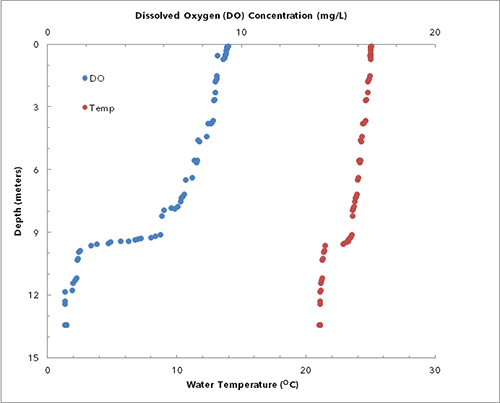
It is important to document the water column profile of dissolved oxygen and temperature at each site trawled. Fish distribution can be dictated by oxygen levels during hot summer months. We use oxygen levels at the bottom of the water column to determine if each site’s trawl data should be included in the basin-wide indices. In many cases, our lowest trawl catches can be explained, and ultimately excluded, by extremely low oxygen levels at the trawl site. Collecting a full water column profile is as simple as selecting the site to log to, dropping the sensors to the bottom, and then logging the data as we slowly pull up the sensors through the water column. The depth sensor is extremely useful. Each water quality reading is depth stamped so that we know exactly where it came from in the water column.”

Data captured with the ProDSS during a trawl survey.
Lake Erie Lower Trophic Level Survey
The Great Lakes Fisheries Biologist also uses the ProDSS to collect water quality profiles during lower trophic level surveys. This data serves as the core of a large database of water quality information. “Our lower trophic level survey is used to document basic water quality at 8 different sites throughout the western basin, along with plankton collections at each site and water samples that are used for lab analysis of phosphorus. Sampling every two weeks allows us to look at water quality trends throughout each year and also gives us a historical dataset to track Lake Erie’s productivity over time.
Phosphorus and plankton samples allow us to look at changes in productivity and the changes in the makeup of the base of the food chain. As harmful algal blooms become more of a concern, these data can be used as a baseline to compare to as nutrient levels change. Forage fish species rely on plankton as a food source and the plankton dynamics that result from changing levels of nutrients can impact the entire food web.”
Data Analysis with KorDSS
After each survey is complete, the Great Lakes Fisheries Biologist analyzes the results using KorDSS, the PC data management program included with the ProDSS. “One of the best features of the ProDSS is how simple it is to download data into Excel®. In the past, most instruments required multiple steps and data format conversions to actually view and work with saved data in Excel. With the KorDSS software I’m only a few clicks away from accessing the saved data in Excel where it can easily be graphed and analyzed.”

Additional Blog Posts of Interest
Free ProDSS Online Training | Everything You Need to Know
Comparing the YSI ProDSS vs EXO Water Quality Meters
Water Quality Meter Plus Smart Sensors Equals Ultimate Handheld