Get Your Lab Ready for HABs
Editor’s Note: The following transcript has been edited for readability and the video was edited to start at the 1:32 mark.
Video Transcription
Transcript by Speechpad
YSI Staff: Some of you have probably been to one of our algae webinars before. A lot of the work that not just I, but the entire YSI and Xylem team have been doing related to harmful algal blooms, you can find at our video hub affectionately called The HAB Hub, as well as our HAB webpage.
So, I come to you as a microbiologist who's been doing a lot of work in water quality over the years. I'm joined today by my colleague from the OI Analytical Brand of Xylem. Tim Smith has been with OI Analytical for 15 years. He is definitely our expert on one of the technologies that we're going to talk to you about today. The FS 3700 platform. Also, in the background, I'm joined today by my colleague, Cynthia Elmore. She is our GC expert. I'm going to be presenting a new method she has developed for us. So, let's get to work and talk a little bit about harmful algal bloom monitoring. I'm assuming you guys already know something about this, or you wouldn't be here. So, we're just going to touch lightly on it to set up the conversation.
HAB Monitoring
We want to spend most of our time talking about these fantastic methods that can help an environmental monitoring laboratory really get some high-quality data that's going to help them understand harmful algal bloom dynamics. So, as many of you already know, the root cause of harmful algal blooms is nutrient pollution. And you're going to hear us talk a lot about that today. In 2015, the EPA had estimated that over 15,000 water bodies in the U.S. had suffered from nutrient impairment. Now, I looked up some more recent statistics that you can see here.
This is just from this week from the EPA's website. And as you can see, it is a very large problem for us in the continental U.S. And by the way, as many of you know, it's a global problem. So, this gives you an idea of nutrient impairment's scope.
And of course, that leads to harmful algal blooms and the impacts of harmful algal blooms. One of the most notorious impacts is the reduced dissolved oxygen hypoxia or anoxia such as in the dead zone of the Gulf of Mexico. That hypoxia is typically what leads to the fish kills that we deal with in a lot of our coastal regions and freshwater systems now. But toxins are harmful to wildlife. We see unusual marine mortality events with things like dolphins, manatees, and even our beloved pets are impacted by this. This is an older publication, but we are now starting to see more education among veterinarians and more identification of this. And this is usually fatal to our dogs that get exposed. The toxins, of course, are dangerous for us too. And so, we really have to make sure they are removed from our drinking water sources.
But the problem for those of you who manage drinking water sources, you guys know that it's the taste and odor problems that HABs cause that you really hear about most often. And of course, altogether, the economic impacts of this globally probably are over a billion dollars a year. I believe this is a conservative estimate. It's really an understudied problem, and it's a hard one to really get a handle on. So, the impacts of harmful algal blooms are pretty widespread and they are all connected to water quality. We've already discussed how increased nutrients are really the root cause, but we start to see more harmful algal blooms in the warmer months because the blue-green algae or cyanobacteria that cause harmful algal blooms they really like those warmer temperatures. And that's where they outgrow what we think of as the healthy algae in a system.
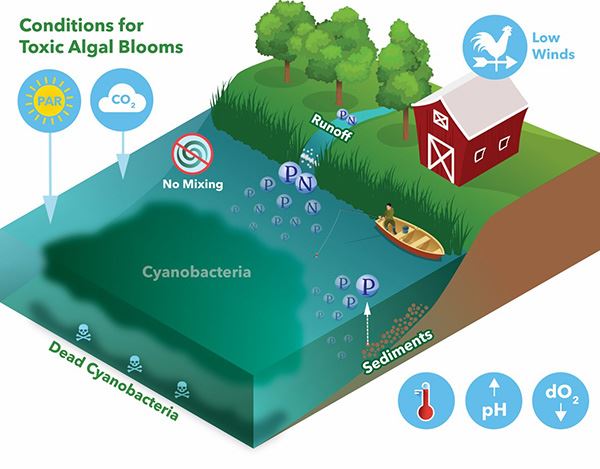
But of course, decreased flow, just really stable waters, favor algal growth. We used to think that you wouldn't get a harmful algal bloom in a big river because of the movement and the aerification of the water. Well, the Ohio River proved us wrong on that point in the last several years, we now get very, very large algal blooms in river systems that get a lot of agricultural inputs of nutrients. (Learn more, Toxic Algae Struggle Has NASA's Attention). But the harmful algal blooms are also changing the water quality. Typically, you get an increase in pH, a decrease in dissolved oxygen, and the pigments are increasing, which are really an indicator of the growth of the algae themselves. So, if you want to understand harmful algal blooms, you've got to do water quality monitoring, and the tried and true tool for doing that, that I've talked to you guys about a lot before, of course, is the EXO multiparameter sonde.
These give you continuous data acquisition in the field. And for some of those most critical parameters, very accurate and highly precise measurements. They give what I would call trending measurements of a lot of the other very relevant water quality parameters. Of course, YSI really changed the game in the last year when we launched the EXO NitraLED sensor, that allows you to get trending measurements of nitrate in a system. But there are limitations, and sondes cannot tell you what species of algae you have. They cannot measure toxins for you. They cannot measure phosphorus or orthophosphate for you, which many regard to be the most important nutrient input when you're talking about harmful algal blooms.
So, if you want high precision measurements of the pigments, or nitrate, turbidity, some of these other things, you really are going to need to supplement your water quality monitoring with sondes with some lab-based tools. And that's what we're here to discuss today is how you're going to get your lab ready for harmful algal blooms to measure specifically today, we're going to talk about total phosphorus, total nitrogen, and then those taste and odor compounds geosmin and MIB. We're going to talk about doing that with two key platforms that the OI Analytical team has designed, the automated chemistry analyzer, the ACA (Automated Chemistry Analyzer) you'll hear us talk about it as the FS3700 is a high throughput system that you compare with an autosampler, and we are very excited to announce you can also pair it now with an auto diluter, which is going to give you really phenomenal data.
And Tim is going to show you an example of that. This system comes with preconfigured cartridges, as we call them, that you can use to do the analyses we're going to talk about. The other system we're going to talk about is our purge and trap system, which you can also pair with an autosampler and a GC mass spec system, as we're going to discuss today.
So, to summarize this lead-in, management and mitigation of harmful algal blooms does require water quality monitoring, and you can do that in the field, but really you're going to want to do a lot of this in the lab to get the most important parameters measured, which is, of course, those nutrient inputs. One of the biggest challenges with harmful algal blooms is those taste and odor compounds.
HAB Monitoring Summary
- The management and mitigation of HABs requires water quality monitoring
- The most important parameters to understand for HAB management are nutrient inputs
- One of the biggest challenges for drinking water reservoirs is management of taste and odor (geosmin and MIB)
- Nutrients and taste and odor compounds are best measured in the lab
- In support or in place of field monitoring
TKN EPA Method 351.2
For those of you in drinking water management, you're going to want a way to measure those when you know your water quality monitoring is telling you that you have a harmful algal bloom. So, these things are best measured in the lab, and my colleague, Tim Smith is going to hop on here and he's going to talk about doing Total Kjeldahl Nitrogen on the FS3700 platform. So, take it away, Tim.
Tim: Hello, and good morning, everybody. We're going to go ahead and start here with the TKN method 351.2. As most of you here know, the EPA does not have an approved total nitrogen method, so there's a need for the total nitrogen method that will give you total nitrogen results, which is TKN plus NO3 plus NO2. Here, we show the different sources of nitrogen. In a water body, nitrogen can be introduced through a variety of sources and can exist in multiple chemical forms in the water.
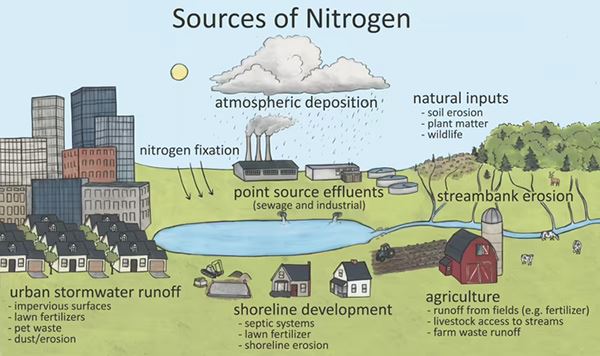
Some of which you will see on the next slide. Total Kjeldahl Nitrogen or TKN is all the organic nitrogen plus nitrate and nitrite in the water. TKN is a popular measurement because it's a good indicator of animal-derived sources, including humans. In other words, wastewater and agriculture runoff can really stimulate TKN.
Here we'll talk about what is TKN and relevance to HABs. The relevance of TKN is for algae that don't fix nitrogen. And even for those who do, it represents immediately digestible forms of nitrogen that might otherwise be limited in supply in the water.
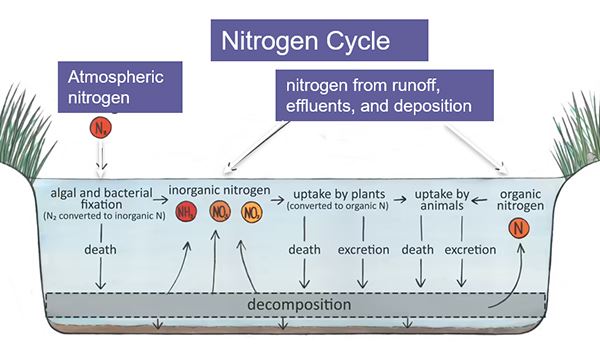
Nitrogen is not generally regarded to be as important for stimulating algae growth as phosphorus is, but we've learned in recent years that it's very important for stimulating the blue-green algae that we don't want too much of it in water. And in fact, might increase the toxicity of those organisms. Okay. And here we show the nitrogen cycle.
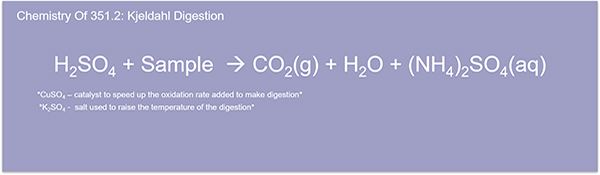
So, here we're going to go into the Kjeldahl digestion method for TKN. So, let's take a look at our method for measuring TKN using the FS3700. The TKN digestion uses sulfuric acid to convert free ammonia and organic nitrogen into ammonium sulfate. Potassium sulfate raises the boiling point to 380 degrees Celsius. And a copper catalyst is also used. The goal is to convert all the available organic nitrogen into ammonium. This is the longest step of the process and can take generally about two hours or so. And if you look down here at the tab, at the bottom here, you'll see the 351.2 method abstract.
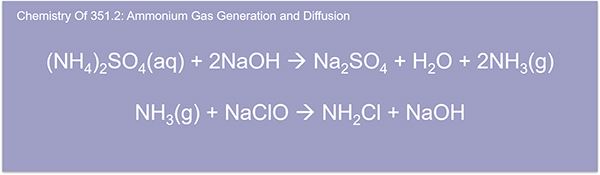
So, here we're going to dive a little deep into the actual chemistry. The sample pH is raised to over 11 with sodium hydroxide, which yields the ammonia gas. The ammonia gas diffuses through a hydrophobic polypropylene membrane and reacts with sodium hypochlorite solution. The reaction between the ammonia gas and sodium hypochlorite yields chloramine.
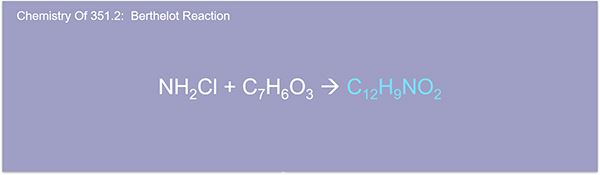
And here's another step for the chemistry. You see here, the chloramine reacts with the salicylate to give indophenol blue. And this indophenol blue is proportionate to the ammonia concentration in the sample.
And here we show the sodium nitroferricyanide, the sodium nitroferricyanide intensifies the blue color, and the entire complex is measured at 660 nanometers. And here, this example of the Berthelot reaction, where phenolic salt reacts with chloramine to form a blue color dye called Indophenol. Most ammonia methods use phenolate, and the most popular TKN method uses salicylate. The Berthelot reaction, they're both foreign products that are proportional to the ammonia concentration. That is what we are measuring after all. In fact, other countries do not use the alkaline for no reagent at all.
Here we show the FS3700 cartridge for ammonia 351.2. You can use the cartridges to analyze drinking water, surface water, wastewater. And it's a segmented flow analysis. And also the same cartridge can also be used for 350.1 ammonia nitrogen. And we have optimized these methods for the 3700s. The cartridge that you use for the 351.2, like I said earlier, can also be used for the 350.1. And we also offer single cartridges for NO3 and NO2 analysis approved by the EPA. So, with the 351.2 cartridge and the 353.2 cartridge as well, you can get your total nitrogen results that are needed to monitor HABs. (351.2 Method Abstract and NO3/NO2 Method Abstract)
So, here we have TKN results on FS3700. On the right here, the screen, you see a results screen, and to the left of that, you see the calibration screen for that particular result.
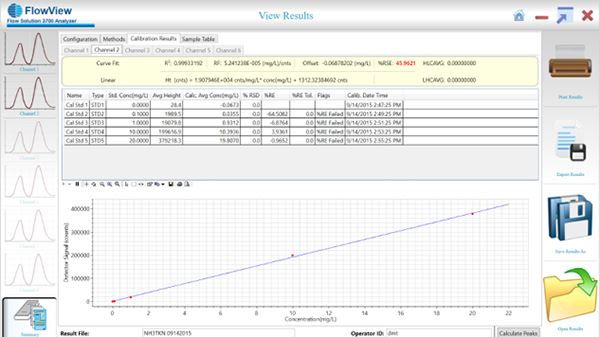
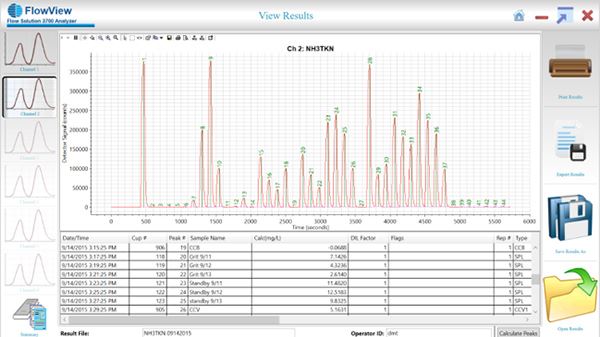
This was submitted by Liverpool Ohio Wastewater Treatment Plant, and this wastewater treatment plant, they monitor effluent, influent, and outfall concentrations to protect the surrounding bodies of water from nutrient runoff. All Right. As I mentioned earlier, on the left, you can see a few results screen where simply you just set up the FS3700 to analyze your samples. And once the analysis is complete, you verify the proper integration of the peaks, and from there, you'll just allow FlowView to do all the calculations, use all the calculations for your peaks. And the calibration curve that is shown to the right, if you take note at the calibration curve, you really want to look at the percent RSC for the entire calibration curve. And in this case, it's pretty high. It's up to each individual lab to determine what is acceptable for your project. But notice, and another note I want to make, this calibration curve was manually prepped by our analysts in the lab.
Okay. And here's the second set of data, TKN that we have here. The same method, 351.2 on the FS3700. And here in this second example, you can see that our percentage RSC for the entire calibration curve is 6.5. In this case, we use the ML 600 diluter mentioned earlier, and you can see that we got a better curve fit, an improved RSC percentage. And this is a trend because I've performed most of the testing. With the diluter, we generally see far less variability from calibration to calibration.
And here we show the method performance for the TKN method. You see the range here from 10 ppt to 20 ppm. You have a sample rate of 40 samples per hour.
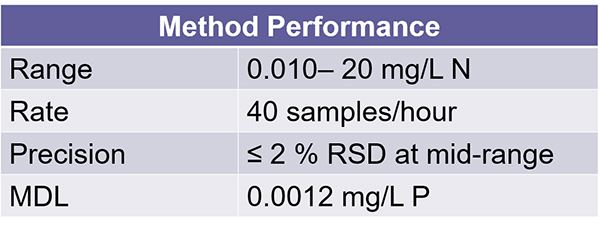
The percentage is based off the mid-range of our calibration curve. And we have an MDL of 0.0012 ppm. And I want to mention here that the range can be adjusted by increasing or decreasing the load time for SFA methods and changing the loop size for the field methods. And also the sample rate can be increased by reducing the cycle duration for both SFA and field methods.
And here we list the sample considerations. We've taken into account some of these sample considerations as we developed the TKN gas diffusion method. The TKN method uses a hydrophobic membrane as mentioned here in this first sample consideration. We always recommend that you filter your turbid samples and digest prior to analysis. I use and we recommend using a Whatman 40 micron filter to actually filter your samples. In some samples, you may run into issues where you have heavy metals in the samples.
Sample Considerations for TKN Gas Diffusion Methods
- Eliminate suspended particulates and ionic interferences by selectively diffusing ammonia through hydrophobic, microporous, polypropylene membrane.
- Filter turbid samples and digests prior to analysis.
- Heavy metals in the sample and digest matrices may interfere by precipitating.
- Remove these interferences through complexation with sodium citrate.
- Occasional issues with residual chlorine.
We recommend removing these interferences through complexation with citrate, and you do have the option to increase that citrate concentration to remove metals that may be in samples, more metals or a higher concentration than normal. And for the residual chlorine, we recommend pretreatment of a sample with sodium thiosulfate before analysis.
This is the TKN nitrogen summary. You see here, TKN is a water quality parameter to aid in the management of nitrification that leads to HABs. And TKN, as we all know, cannot be measured in the field. So, it is a lab-based analysis. And keep in mind that the FS3700 platform, we have chemistry cartridges, we have auto dilution, and methods to support TKN. And paired with the FS3700 nitrate and nitrite method, one can derive total nitrogen in their lab, which is important until the EPA finally approves a one and all total nitrogen method.
Total Kjeldahl Nitrogen Summary
- TKN is a water quality parameter to aid in the management of eutrophication that leads to HABs
- TKN cannot be measured in the field—it requires a lab-based colorimetric method
- The FS3700 platform has pre-configured chemistry cartridges, autodilution, and methods to support TKN
- Paired with FS3700 nitrate and nitrate method, one can derive Total Nitrogen (TN)
That concludes our TKN portion of the presentation. Are there any questions before we move on to the total phos?
YSI Staff: Yeah, Tim. So, first of all, thank you very much. That was really, really well done. I appreciate it. And John has actually asked an excellent question, you're just the guy to answer it. He wants to know how many Xylem customers are performing the TKN digestion. So, I think what he's getting at here is that people that aren't under regulatory constraints they might use persulfate digestion. Do you have any experience or comments on that?
Tim: I have. Most of the labs that I run into, they do have requirements and they do use the typical TKN digestion, but we do have some labs that do not have any regulatory requirements. And they also use, I guess, the non-traditional persulfate digestion. I couldn't give you a number. I couldn't attach a number to the number of labs, but I do know there are some labs out there that are doing just a persulfate digestion. If you want to have a discussion or start a discussion about that, you're welcome to send me an email. And I'm pretty sure my email address is available, but if it's not, it's tim.smith@xylem.com.
YSI Staff: Excellent. Thanks. Yeah, thank you so much, Tim. One of the things that Rebecca Reeves is asking is if you have many issues with matrix interference from high nitrate values?
Tim: Okay. And when we say high, did she list the concentration of the nitrate value?
YSI Staff: She did not. She did not give a range. Rebecca, I don't know if you have a concentration range in mind there that your samples often have? But maybe more, generally speaking, Tim, is there a threshold where nitrate starts giving you erroneously high TKN?
Tim: If I recall, I think that that threshold may be 20 ppm, but I definitely can validate and confirm and get back with you about that. But I want to say it's 20 ppm if my memory serves me correctly.
YSI Staff: Excellent. Wow. That's what's so great about having someone like Tim who has so much experience running these, you will never get that precise of an answer out of me, by the way. So...
Tim: Keep in mind, I need to verify that as well, but my mind tells me it's 20 ppm.
YSI Staff: She did not. She did not give a range. Rebecca, I don't know if you have a concentration range in mind there that your samples often have? But maybe more, generally speaking, Tim, is there a threshold where nitrate starts giving you erroneously high TKN?
YSI Staff: So, Rebecca, we'll follow up with you on that question. And Becca, if you'll make a note that we want to get back to Rebecca on that, let's make sure we do that. Gary Alexander wants to know what filters you have used to remove interferences.
Tim: For filters, pre-analysis, or like you said, during analysis, are you talking about the wavelength filters, or is that...? I just need a little bit more.
YSI Staff: I think he means the pre-analysis filters because he's talking about interference removal. So, I think somewhere, you had mentioned a Whatman filter.
Tim: Yeah. We actually use a Whatman filter with a 10 ml syringe. And what we do is when we draw in the sample, we attach the filter to the end of that syringe and we push the sample through and we try to collect as much as the original sample as possible.
YSI Staff: Excellent. Excellent.
Tim: Yeah. That normally removes any interferences that you might have. And I'm assuming when he says interference, he means color because some samples come in, they do have a certain color, like a blue color or a tint of color that's similar to the indophenol that's produced during the reaction.
YSI Staff: And he does follow up here and say, yes, he's talking about pre-analysis interferences. So, Dan, you've asked a question about phosphorus, and actually, I'm going to put you off a little bit because I have a feeling it's going to get answered in the next section. And John followed up and said he wishes he could convince more researchers to use persulfate. You know, John, we'd like to hear more about that. If you want to provide any comments about why you prefer that method, it would be interesting for us to follow up with you and see if that's something we should talk more about. Pete has asked whether Xylem offers solutions for actually performing the digestion. Do we have a digester, Tim?
Tim: We don't have a digester that we sell, like with the OI unit, part of the OI system to do digestions, but the Gerhardt System, they have. It is capable of doing TKN digestions. And if I remember correctly, it also has a program, it's pre-programmed to do TKN digestions. You can modify the program to adjust how many hours or temperatures. But there's a digestion program already hard-coded into the Gerhardt System.
YSI Staff: Yeah. And one of our listeners is pointing out that TKN is a big pain to do. And so using one of these automated digester systems is something that the Xylem team can help folks with. If you want us to contact you, let us know at the end of the webinar, we're going to give you the opportunity to let us know if you want us to reach out to you. Dawn is pointing out that her lab runs both the ammonia and TKN on wastewater samples using the FS3700 and it works wonderfully. Dawn, we really appreciate that comment. Thank you so much. So, hey, there's a...
Tim: Is that Dawn Myers in Orangetown?
: That is Dawn Myers.
Tim: Yeah, I know Dawn. I know Dawn.
YSI Staff: She did not. She did not give a range. Rebecca, I don't know if you have a concentration range in mind there that your samples often have? But maybe more, generally speaking, Tim, is there a threshold where nitrate starts giving you erroneously high TKN? : So, I think you guys can see why we're so happy to have Tim here today to answer these questions for you. So, let's move on and let him tell us more about doing total phosphorus with EPA method 365.4. So, Tim, I'm going to let you take it away.
Total Phosphorus EPA Method 365.4
Tim: Okay, guys. So, we're going to go ahead and jump into the EPA method 365.4, total phos. And similar to the TKN slide, we have the source of phosphorus here. There are dozens of chemical forms of phosphorus in the environment.
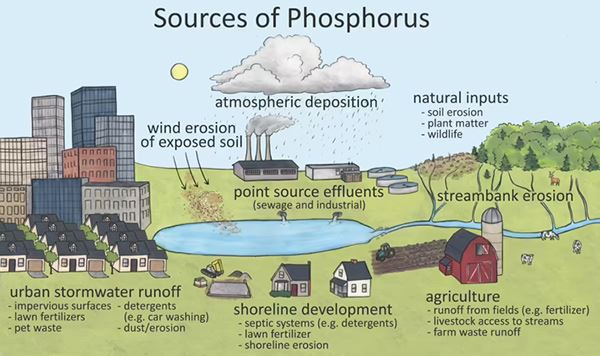
The orthophosphate is the form that is most readily utilized by biological organisms. Ultimately, most forms of phosphorus will become orthophosphate. And so, understand that total phosphorous in the system is important. The sources of phosphorous are widespread. And as you might guess from the pic above, they have increased with more urbanization and development of land for agricultural use.
So, here we talk about what is TP and how TP affect HABs. In freshwater system, phosphorus is at a just low enough concentration to keep algae growth in check.
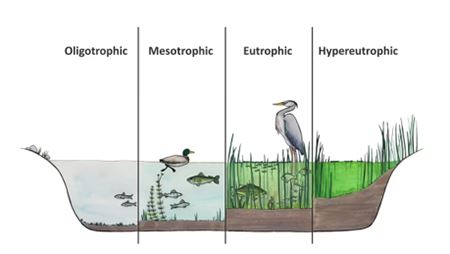
So, when the phosphorus starts flowing into the system, nutrient enrichment also called nitrification can stimulate algae growth. When we talk about HABs in nutrients, we usually focus on phosphorus. But nitrogen also plays a key role, and many people measure the ratio of total nitrogen to total phos when studying HAB dynamics. Measuring both in the laboratory is just fundamental to monitoring conditions that favor HABs.
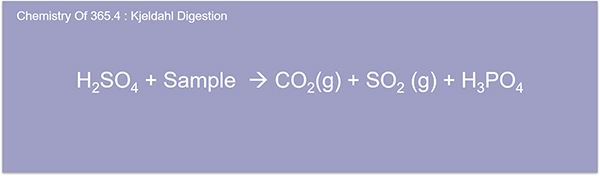
Here we're going to discuss the Kjeldahl digestion for total phos. And it's similar to the TKN digestion where you have sulfuric acid plus a sample. And you have some CO2 and SO2 and you have an H3P04. And then just so everybody knows we have a submitted flow analysis for development for measurement of phosphorous in water samples. (Total Phosphorus by SFA 365.4 abstract)
And I take note, I've been going through the presentation, but I've failed to mention that here, these little green tabs that you see, the green buttons, they will take you to an abstract for each one of these methods. So, the total phos and the TKN method, you should be able to access the abstract for that.
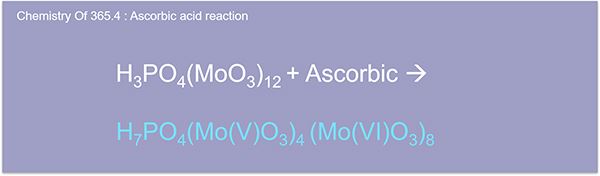
Okay. Here we're going to go ahead and dive into the orthophosphate chemistry complex. The analysis is accomplished by reacting an ammonium molybdate antimonyl potassium tartrate solution to form phosphomolybdic acid.
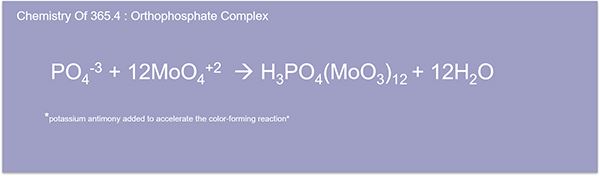
Here we have the antimonyl molybdate complex called molybdenum blue. The intensity of which is proportional to the amount of phosphorus in the solution. If only phosphate is required, the digestion step is omitted, and analysis proceeds from there with the option to use ion chromatography instead of color imaging.
We focus on the 365.4, but just know that we have other methods for phosphorus, and you can find those at these links.
Total Phosphorus by Segmented Flow Analysis (SFA), USEPA 365.4
Low-Level Phosphorus - All Forms USEPA 365.1 by Flow Injection Analysis (FIA)
Phosphorus (All Forms) Using USEPA 365.1 by Flow Injection Analysis (FIA)
Total Phosphorus by In-Line UV/Persulfate Digestion and Flow Injection Analysis (FIA)
Here, we just show our different configurations and the methods that we offer. We have all our methods applied to drinking water, surface water, and wastewater. We have flow injection analysis for you guys, production labs, who want to actually analyze a lot of samples in a short period of time. We have our methods here, our low P, we have a low-level phos, all forms phos, and we have a total phos method via UV per sulfate digestion, which is approved by standard methods in the ISO organization. So, we have a variety of phosphorus methods that you can employ into your lab, and hopefully, get you some good phosphorus data.
Now, and similar to the TKN here, we have a results screen of total phos. We have the calibration curve here. Right. We're in total phos. So, here this is also from Liverpool Wastewater Treatment Plant. But I also mentioned total phos along with TKN. This is really important for them because they have discharge limit for total phos. Again, this example, they were using manual dilution and they achieved higher linearity within an RSC of 10.8%. So, 10.8%, I think that's probably acceptable, but like we said before, most labs, they have to set their own pass-fail criteria as far as the relative standard error percentage. And here, again, we would expect the ML600 to yield a much better RSC, but unfortunately, we don't have that data to show you for this example, but you can take my word. I'm really impressed with the ML 600 that diluted the way it performs and how consistent it is. So, I'm looking forward to you guys probably purchasing one and probably giving me a call and just having a few questions of overall questions about it.
Here, we also listed the sample considerations for the total phos. We make mention you want to filter all your samples prior to analysis, and you want to be aware of the samples with background absorbers at that analytical way that may interfere. And then I can't stress this enough, if you plan to analyze for phosphate, be sure to rinse all your glassware with at least a 0.1 to one normal solution of HCL to keep your glassware phosphate interference-free.
Sample Considerations for Total Phosphorus
- Filter turbid samples
- Samples with background absorbance
- Residual reacted phosphate
- Wash the system and glassware with 0.1-1 N HCl
- Other compatible procedures for removing or suppressing interferences
- Take care to keep all such items free of contaminants.
What I do here, I have dedicated glassware in the lab that I only use for phosphates, and I keep it separated from my other glassware. So, you have a few interferences that you can use. But from my experience running phosphorous, and you guys can probably speak more to this because you guys are dealing with real-world samples. You don't have a lot of interferences that you need to treat or suppress. But I state again, please be sure to rinse all your glassware with at least a 0.1 to 1 normal HCL solution, and just keep it free of contaminants or what have you.
And here we have the method performance for our total phos method. It ranges at 10 ppt to 20 ppm. You have a sample rate of 60 samples per hour.
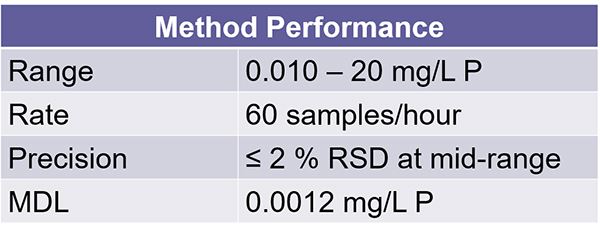
Our precision again here is less than or greater than 2%, and that's based on our mid-range calibration point during development. Our MDL here's 00.12 ppm. So, it's a standard method performance criteria that you would see for most of our methods on the FS3700 platform and our previous FS3100 platform.
As we mentioned before with the TKN, total phos is a water quality parameter to aid in the management of nitrification that leads to HABs.
Total Phosphorus Summary
- TP is a water quality parameter to aid in the management of eutrophication that leads to HABs
- The most accurate TP measurements are made in the lab
- The FS3700 platform has pre-configured chemistry cartridges, autodilution, and methods to support TP
And the most accurate total phos measurements are made in the lab. And as we mentioned before, we have our preconfigured chemistry cartridges. We now also offer the autodiluter, and we have the means and the methods to support the total phos. So, Stephanie, that kind of wraps up our presentation about the total phos section. Do you see any questions from the audience that I could entertain?
YSI Staff: Yeah. Actually, we have a question that I'm going to knock down for us, Tim. Diane has asked where she can find more information about the N-to-P ratio in harmful algal blooms. Diane, and I'll type this in the response so that you have it, but for the rest of the audience, that is sometimes called the Redfield ratio. That Redfield ratio is something that has been in existence for a long, long time. And it used to be the rule of, if you had a Redfield ratio, and I honestly don't remember the exact threshold, but if that ratio was below, I think it was one, if it was below one, you had HAB favorable conditions. If it was above one, it was less favorable to HABs. Over the years, that actual hard line has sort of been debunked, and we know that it's different for different types of harmful algal blooms.
For instance, it's different for red tides than it is for a Microcystis bloom in Lake Erie. But there is still a lot of value to understanding the red field ratio in your system. And that's why, if you're working with HAB systems, we really think it's important to measure both total nitrogen via TKN, nitrate, nitrite, and then total phosphorus via the methods that Tim has talked about here. So, really appreciate that question, Diane. Tim, for you, Cassandra is asking, is not rinsing the glassware the most common contamination problem you have in the total phosphorus methods?
Tim: From what I've seen, yes, because most times, like all of you, when I'm washing my glassware, we use some type of soap. We use some type of soap or foaming soap, or what have you, and most soaps, liquids, dishwashing detergent, and laundry detergent contain some type of form of phosphate. Right? You can find a phosphate-free detergent. If you have that and you still having contamination issues, that may be something else we need to discuss. But from just general washing solutions, whatever, they always contain some type of phosphate, so that's why I recommend just rinsing the glassware well with one normal HCL.
If you have the capacity in your lab, you could also soak your glassware in one normal HCL, because, not to ramble on, but now that I think about it, the glassware that you need is probably going to be the glassware you need to make your reagents and the glassware you need to prep your calibration curves. You know, 100 mls or 50 mls. So, I would just take that extra precaution. And if you have time, I would just soak my glassware in one normal HCL. But from what I've seen in my experience, that type of contamination is probably the most prevalent when you're doing this total phos or orthophos method.
YSI Staff: Excellent. Tim, thank you so much. And I remember back in the day we used to use Alconox, is that still the phosphate-free detergent that people use a lot in the lab? Is that one you've used, Tim?
Tim: Now, that's one that I have. I guess you can call me paranoid, even though I used an Alconox, I still soak and rinse my glassware that I'm going to use for total phos analysis in one normal HCL.
YSI Staff: Very good. And we used to set up acid baths in the sink in the lab. We used to use nitric acid, but that is so bad for the plumbing that I think Tim's recommendation of using a dilute hydrochloric acid is the right way to go. Typically, when you buy hydrochloric, it's going to be 12 normal. So, you're going to want to do about at least a 1 to 12 dilution of that to set up your acid bath.
So, that's a really, really good tip. One person is saying, Rashmi is saying that if you use unused or new glassware, sometimes they don't soak, and I've done that too, Rashmi. If you buy disposable, it needs to be borosilicate glass. You can sometimes get away with that.
Geosmin & MIB EPA Method 524.3
So, let's move on in the interest of time. Tim, really, really wonderful inputs. We're going to move on now to talk about the taste and odor compounds. I'm going to hop back on camera here as your presenter, and we will switch out there. And just in the interest of full disclosure, I am not an expert in GC. My expert in GC though is here to back me up on questions, but if I can't help with your question, I will definitely make sure we follow up with you. So, I do want to tell you, though that Cynthia Elmore has developed a wonderful method here. I'm very excited about this because I've wanted to see this for years. So, first of all, as already mentioned, geosmin and MIB are taste and odor compounds. If you've ever gone outside after the rain and you smell that earthy scent, that's because of geosmin and MIB in the soils being volatilized.
Those are typically made by Actinomycete and Streptomycete bacteria. But in the water, it's more likely to be made by algae. Humans can detect this as low as five parts per trillion. And it is obviously volatile, but it is completely non-toxic. So, sometimes this is associated with toxin production, but these compounds are completely non-toxic. That might not really matter, though, because as many of you know, people are more likely to call your drinking water plant because of taste and odor problems than they are because they saw something on the news about toxins. Interestingly enough. Geosmin and MIB are made by some, but not all blue-green algae and not all the time. But for a lot of reservoirs, particularly those that routinely have harmful algal blooms, you might think of geosmin and MIB as the canary in the coal mine, telling you that something is about to happen.
There have been studies that show co-occurrence with toxins, but this really does seem to be kind of site-specific. So, we encourage you to collect the data to understand how predictive these compounds might be of a toxic algal bloom. I want to also point out that I did a webinar a few years ago now, the pandemic has disrupted my timeline, about treatment options related to harmful algal blooms. And Xylem has a technology made by Wedeco that we have some advanced oxidation procedures that are amazing for dealing with these compounds and the toxins at the same time.
The methods though for geosmin and MIB, one of the biggest challenges is because humans can detect it at five parts per trillion, a lot of drinking water, sometimes regulations in some countries, sometimes guidelines in other countries, they want you to have less than one part per trillion in your finished water. If you're going to do that, you're going to have to use GC-MS with selective ion monitoring. That's the only way you're going to get that level of sensitivity. And that is going to require you to do some concentration of these analytes in your sample. So, how are you going to do that? Probably one of the most popular approaches today is solid phase microextraction. And to be more precise, Headspace solid-phase microextraction. In that case, there's a fiber, that's a fused silica fiber, it has a polymer coating, and it is inserted into the Headspace of your vial, and geosmin and MIB will absorb to that.
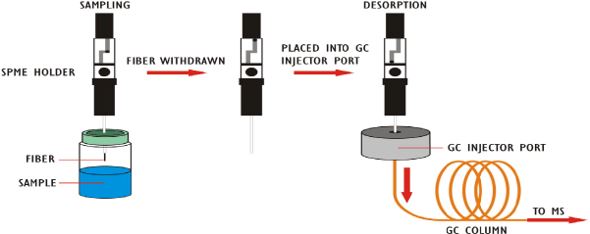
And then it's desorbed via heat. And then you go into a split, split less GC injector. So, it's a very popular method. It is plagued with some variability. And that's one of the reasons that it's not always the ideal method. So, we wondered if we could do this with our purge and trap. So, this diagram illustrates the principle components of pretty much any purge and trap instrument, not just ours. And it shows that the gas flow path in red and the GC carrier gas is shown in blue. Now, in this case, the purge gas is going to pass through the sample and the analytes are going to be transferred out of the matrix and carried onto the trap. For those of you familiar with our systems, you probably are using the number 10 trap. It's our most common trap.
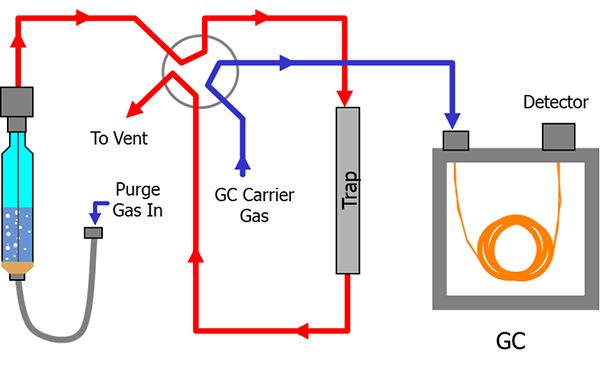
The number seven trap is what we recommend for this method. And then, of course, it's going to be desorbed from the trap via the carrier gas, that's the purge part, and then pushed through a column, and then onto the detector. The nice thing about this is really, from the perspective of the analyst, the extraction concentration sample intro is really all handled in one step within the system. So, in our case, we did this with our 4100 Auto Sampler and our 4760 Eclipse Purge and Trap. We have this coupled in Cynthia's lab. By we, I mean Cynthia has this coupled to an Agilent 7890 system. This can also work, by the way, if you're using the more current 8890 system.
So, the goals, now, why were we doing this? Because as I mentioned, a lot of people are already using SPME for this. We wanted to achieve really high sensitivity. You can get that with SPME, but we wanted to really get high reproducibility. And we wanted to do it using a method that a lot of environmental labs are already running. And so, you don't have to change out your column. You don't have to change out your sampler to be able to do this method. And that meant leveraging EPA 524.3, which is pretty much the standard VOC method that a lot of labs are running. We didn't want to have to salt the sample, which is very commonly done with some of the SPME and other purge and trap methods. And we wanted to use less volume than had been used in the past, 25 mls was common in the past. We're using 10 mls. Now, it's worth noting here that this is the one area where we do deviate from the standard, the EPA 524 method. The current standard method, unlike its predecessor, requires you to use 5 mls of sample. So, this is where we deviate.
And that's why we say that we are guided by the EPA method rather than following it to the letter. The other thing to note here is that Cynthia was able to optimize the method so that you're using what's called a low-temperature purge. So, rather than 80 degrees C, she's doing 60 degrees C. So, she started with some older methods and really evolved it and adapted it for the more current technology, which is the 4760.
So, how did it work out? For those of you familiar with GC, we used 1,4-dichlorobenzene-d4 as the internal standard. But in most of these charts, you're going to see me representing 1,2-dichlorobenzene-d4, which is the surrogate standard or SS in these methods. (Geosmin/MIB Method Application Note).
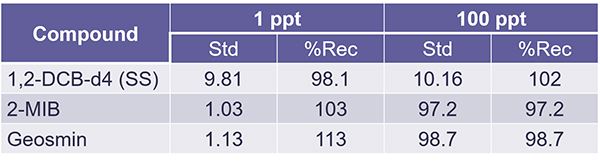
Now, the EPA method we're using here is unique because it makes you recalculate every single point on your calibration curve and meet a specific percent recovery criterion.
On the lowest point of your curve, the one part per trillion, you have to have plus or minus 50% recovery, but at all other levels, you have to have at least 30% recovery. So, in our case, these were the concentrations we ran. And I'm just showing you the low and the high point here where you can see that we readily met those acceptance criteria.
Now, minimum reporting levels, when we're talking about sensitivity, that, of course, is the thing we care the most about. For this, we evaluated seven replicates as per the method.
And you calculate something called the prediction of interval results, and you can refer to the EPA method for that definition. That is actually used to confirm your minimum reporting level. This is different. By the way, I learned this from Cynthia this week. That is different than an MDL.
The EPA also has methods for calculating the MDL, which is really almost more about your analyst than your method. So, this is different. In the case of the injected value for MIB and geosmin, that was one part per trillion. And as shown, Cynthia readily achieved the acceptance criteria for PIRs that are laid out in method 524,3. And by the way, let me just mention here, and I should have mentioned this on the last slide too, that the surrogate standard is at a concentration of 10 parts per trillion rather than 1 like the analytes of interest.
So, finally, we wanted to do the IDC, the initial demonstration of capability.
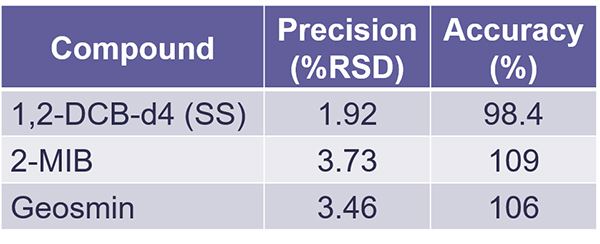
We did this with seven replicates also. Again, we had 10 part per trillion on the surrogate standard, but 25 part per trillion on the target compounds. And in this case, for the IDC, we were going by relative standard deviation targets, and then plus minus values on an accuracy. And once again, this demonstrates that Cynthia was able to readily achieve these targets for the IDC.
What did we learn, though, when we were doing this? And I tell you, this involves some phone calls. It involves some phone calls with some customers who were doing some similar stuff. It involved some phone calls between Cynthia and I to try to troubleshoot. And the upshot is that use very clean water. This method is for finished drinking water. We have not tried this yet with environmental samples, and we really just don't know how it would work. We would love for some of you on the call to check that out for us though, or to work with us on that. So, let me know if you're interested in that, but she did learn the hard way that you have to have a very clean sample pathway. And in her case, she needed to clean the source on her mass spec also.
Sample Considerations for Geosmin and MIB
- Method 524.3 is for finished drinking water
- Haven’t tested this method with source water
- Clean sample pathway, clean MS source
- Recommend minimum of three vials for sample testing
- Use same care you would use for all VOC sample collection
And she wanted to do a minimum of three vials. If we're honest, that's just good scientific technique, right? When you're doing environmental monitoring. But she also said to use some care, the same care that you would use for collection of any VOC. So, if you're using the 40 ml vials, make sure you get the bubble on top, make sure you're using the septum top. You want to use the same care that you would use for any VOC analysis. So, with that, and like Tim did, I want to point out to you here that this method is already online. We'll probably be making a few tweaks to it online, but it is available for you if you want to go to OI Analytical and look for it. All right.
So, to summarize then, taste and odor compounds, in this case, really geosmin and MIB, they are among the most insidious problems caused by harmful algal blooms. The ideal method needs to achieve these things.
Geosmin and MIB Summary
- Taste and odor in drinking water are among the most insidious problems caused by HABs
- Ideal method should have
- ≤ 1 ppt detection limit
- No pre-treatment of samples
- Minimal reconfiguration of instruments
- This method for the 4760 Purge & Trap achieves ≤ 1 ppt MRL, employing EPA 524.3 and a common setup found in many environmental labs
We also saw the ideal method as not requiring any salting of the samples, and Cynthia achieved that here. So, it achieves the target, we're using a common method used by a lot of you already. So, you don't have to change much. You might just change to your number seven trap.
John was asking about the dichlorobenzene-d4. Does that mean that it's deuterated dichlorobenzene? If I'm honest, I'm not sure about that, John. And Cynthia, if you can tell us what the D4 of the dichlorobenzene-d4 means. And just deuterated makes sense since we're talking about doing mass spec, but Cynthia, if you would use the chat to verify that for us, if that is actually correct, we'll get that answered for you, John. I don't see any other questions.
Cynthia, by the way, John did confirm that the D4 does mean it's deuterated. So, yes, it is for use with the mass spec. That makes sense. Okay, cool. I don't see any other questions. You guys have been a great audience. You've been really, really engaged. Blake Judge is also confirming that the D4 means four deuteriums. So, yes, that is how that will work on the mass spec.
