Evolution of Water Quality Sampling
Water Quality Monitoring Throughout the Years
Deep in our primal being, testing water quality has been central to the human experience — and human survival. When we shared the watering hole with mastodons and saber-toothed cats, understanding water quality was an immediate need (though it was addressed on a pretty broad-brush basis).
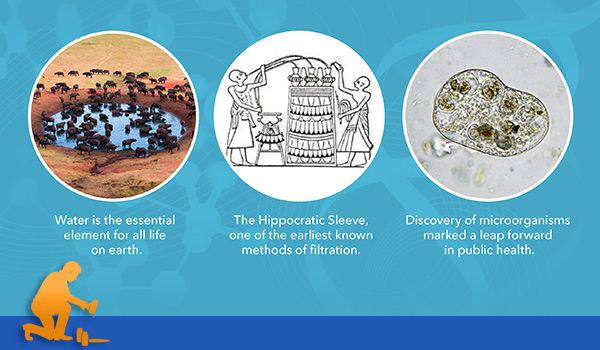
Our understanding of health and science has flowed from the need for clean water. From the Hippocratic sleeve for filtering water to the teeming droplet under van Leeuwenhoek’s first microscope to the birth of modern epidemiology in 1854 at London’s contaminated Broad Street pump, water quality and modern science have been constant partners.
Driven by technology, public health, science, and environmental concern, the past few decades have been the most exciting yet for water quality monitoring. Technology has rapidly evolved to meet the needs of regulatory agencies, universities, environmental consultants, and municipalities.
Sampling capacity has advanced from a few hand measurements a day, one parameter at a time, to constant streams of data transmitted by multiparameter instruments deployed for months at a time. And the resolution of data — temporally, spatially, and in terms of accuracy — has spiked.
The Resolution Evolution
The evolution of water quality testing technology — and the lessons we can learn from it — is perfectly illustrated in these three charts. YSI calls the challenge of trying to make decisions — and assumptions — based on too little data the “undersampling dilemma.” Our goal in constantly evolving our instruments is to allow YSI customers to have enough information to understand the systems they are measuring and make sound decisions based on the highest quality data.
|
|
Sampling Weekly
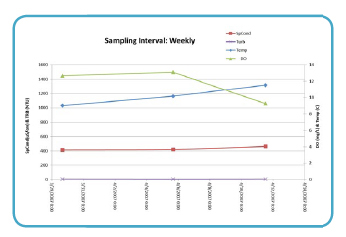
Gathering data weekly for a two-week period yielded a simple, stable chart and the idea that dissolved oxygen fluctuates by about 3 mg/l at its most extreme and the average DO level is 11.66 mg/l.
|
|
|
Sampling Daily
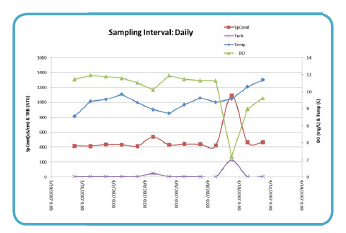
Monitoring the river once a day yielded a dramatic look at the correlation among DO, temperature, and specific conductance — in a huge drop of more than 10 mg/l that was not even detected in the weekly monitoring program.
|
|
|
Sampling Hourly
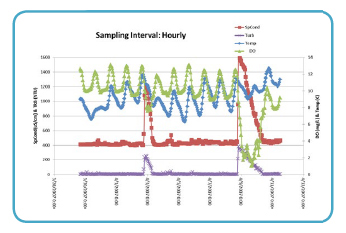
Increasing the monitoring frequency to hourly by deploying a multiparameter sonde at the site reveals more dips and spikes in specific conductance, DO, turbidity and temperature. Diurnal cycles become clear and a brief event at the end of the deployment was detected.
|
The Next Step
We can sum up the journey to today’s water quality monitoring technology in one word: more.
More parameters. More flexibility. More time in the water. More depth. More data. More resolution. More connections among the things we observe and our understanding of the world’s water.
From the lab bench to the riverbank to the deep, blue sea, our understanding of water quality — and our ability to make sound decisions based on our observations — draws together remarkable minds around the world. The next step, of course, is giving those experts the tools to explore water quality at a level of detail beyond imagining just a few years ago.
Water quality monitoring instruments have taken complex laboratory capabilities into the field. At every step, water quality sampling equipment has gotten smarter, smaller, and more rugged based on years of experience and the yearning to provide our customers with the best instruments. Many of the measurement technologies have moved from wet chemistry to optical sensors, and from electrochemical to optical-based systems.
Growing Awareness
As our measurement technologies have developed an understanding of the world’s water has grown, so has awareness of the importance of clean water. This in turn has spurred water quality regulations worldwide.
America’s 1972 Clean Water Act
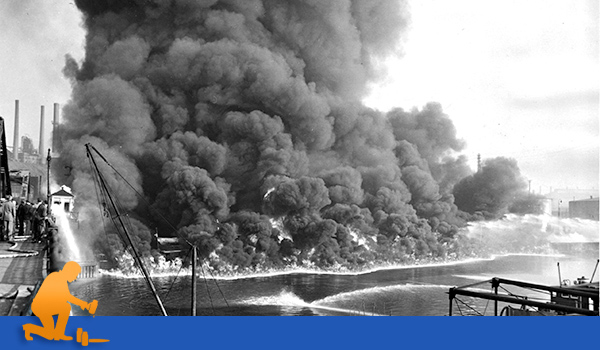
Americans grew wary of dye-colored rivers in New England and periodic fires on the oily surface of Ohio’s Cuyahoga River. Following one such fire in 1969 — actually, the 13th fire recorded on the Cuyahoga in a century — the U.S. Congress gathered the political will and momentum to strengthen water quality regulations with sweeping legislation commonly called the Clean Water Act (CWA).
Effluent limitations were established, and wastewater treatment plants were funded nationwide. The CWA required pollution discharge permits with numerical criteria for point sources of pollution. It established a framework requiring states to monitor, report and improve where necessary, the chemical, physical and biological integrity of the waters of the state.
Subsequent amendments added urban nonpoint sources to the target lists and required water quality management plans from municipalities. That was a clear call for data. Finely tuned, high-resolution data that is reliable enough to take action.
China: Dawning Insight
Bedeviled by devastating pollution and some of the worst floods in human history, China’s infrastructure agencies and Ministry of Environmental Protection face epic challenges daily. A historic lack of data hampered their efforts.
But when China’s president and chairman of the Communist Party Hu Jintao called for greater scientific development on water quality issues — including drinking water safety, pollution prevention, and water conservation — in 2007, China’s water quality measurement efforts shifted into high gear. Today, government officials and non-government organizations (NGOs) are building the nation’s body of knowledge on China’s water supplies.
The European Union: Long Tradition
The European Union (EU) — as a multi-national community and as individual member countries — has a legacy of strict water pollution regulations that date back more than three decades. Notably, the EU Drinking Water Directive of 1998 established 48 microbiological, chemical, and indicator parameters that must be monitored and tested regularly. In 2000, the Union’s Water Framework Directive required member states to characterize each of their river basin districts and review human impacts on water every six years.
Australia: Jungle to Desert
From the jungles of the north to the arid, red center and mountain streams of Tasmania, Australia spans some of the world’s most diverse climates. So it’s no surprise that the country’s National Water Quality Management Strategy relies heavily on local insight — local regulations and local data. With an emphasis on nutrients, chlorophyll, and biological parameters, Australian regulations build on reference data gathered in relatively undisturbed systems as guides to developing water quality guidelines that lead to water quality objectives.

Shifting Landscape
Regulation has pushed water quality measurement into the spotlight around the world. Baselines, reference numbers, quantitative goals and a constant demand for compliance data have made accurate measurement absolutely vital at every level, from treatment plants to farm edges to mid-stream gauging and monitoring stations.
Growing engagement with a wide range of stakeholders inspires more people to measure water quality, making the need for reliable, user-friendly instruments more urgent. And a spiraling supply of high-resolution data challenges researchers, consultants, and engineers to interpret the findings and improve the quality of the world’s most precious resource.
The great news: in most cases, it’s working.
