The Science of Phosphorus
The History of Phosphorus
(Updated September 2021)
A German alchemist named Hennig Brand discovered phosphorus, albeit accidentally. His experimental subject was human urine. It is estimated that he processed 1,500 gallons of pee in his career. This would have required many  sources, of course, and it is likely that he had to coerce dozens if not hundreds of people into donations. In our time, Brand might be behind bars, but in his time he was just another alchemist seeking the Philosopher’s Stone, a substance with magical powers believed to be able to turn base metals into gold or silver.
He was convinced that it could be produced from concentrated urine. What he discovered instead was pure Phosphorus. Shortly thereafter he also discovered that pure phosphorus burns spontaneously in air, inadvertently burning down his laboratory. It is so reactive, in fact, that it is always combined in nature, usually as phosphate, a phosphorus atom bonded with 4 oxygen atoms with the chemical formula PO43-.
Phosphorus Science
Phosphate compounds are present in all living organisms. In humans, the largest portion occurs in bones where, together with calcium, it forms the mineral apatite. It is also part of genetic material (DNA and RNA) and the compound adenosine tri-phosphate (ATP), the molecular unit of currency for energy transfer in cells (metabolism). The recommended daily allowance for phosphorus is about 4 g/day but varies depending on your age and condition. Excess phosphorus is processed in the kidneys and discharged in urine and feces at a rate of about 1.3 g per person per day which equates to 29 lbs. P/day, mostly in particulate form, for every 10,000 population equivalent.
Phosphates are also very important for hygiene. Phosphates sequester hardness, solubilize soil, and enhance clean rinsing making them an excellent cleaning agent, except for the undesirable effects once returned to the environment. As a result, phosphates have been removed from many consumer cleaning agents. Proctor & Gamble stopped using phosphates in laundry detergent sold in the US in the early 1990s. Even so, approximately 0.5 g P/day is estimated to enter the collection system from laundry and dishwashing detergent per person per day which equates to another 11 lbs. soluble P/day for every 10,000 population equivalent.
So that’s 40 lbs. of phosphate as P per day not counting industrial sources of which about two-thirds is particulate and about one-third is dissolved, mostly ortho-phosphate. This equates to a concentration of about 4.8 mg P/L from daily human activity using 100 gpcd. Industrial wastewater may contain a much higher proportion of P, for example, from meat-packing facilities and metal processing. However, point sources of treated municipal wastewater are not the largest source of phosphorus that is discharged to the environment.
Why Does Phosphorus Matter?
Nationwide, runoff from non-point sources is the largest source of nutrients, including N (nitrogen) and P (phosphorus) discharged to surface water. Although phosphorus is the 11th most abundant element in the earth’s crust, most natural phosphate compounds are very insoluble, and therefore, not quickly replenished. Therefore, plant-available phosphorus is only a fraction of phosphorus in the soil. To make up for the difference between what is available and what is needed, more soluble forms are created for use in commercial fertilizers. Unfortunately, this same property makes them susceptible to runoff to surface waters through field tiles, storm sewers, and non-point sources.
So, why are the treatment regulations so stringent when the main problem is in the fields? Indeed, scrutiny over HABs (harmful algae blooms) in Lake Erie and other locations has, rightly so, been directed towards the agricultural sector. (Learn more, Harmful Algal Bloom Blog Posts). However, unlike the examples above, quantifying the amount of P in agricultural runoff is complicated (Wisconsin’s guidance on calculating P index to estimate runoff potential is 33 pages long!).
Still, there are options to offset point source loads with non-point source reductions. For example, in Wisconsin adaptive management is a compliance option whereby point sources partner with land owners to restore the watershed and reduce in-stream phosphorus concentrations to water quality standards. However, for many reasons, adaptive management is not a practical alternative for many WRRFs (water resource recovery facilities). Some additional treatment will be required.

The Status of P Regulations
When a watershed does not meet attainment status for designated uses, there are three main mechanisms for regulation of phosphorus in treated effluent from a WRRF discharged to surface water: technology-based standards, total maximum daily loads (TMDL), and water quality based emission limits (WQBEL). Technology-based standards are probably the most common form of regulation. However, it is the WQBEL which are currently the driving force for more widespread regulation.
Technology-Based Limits
Technology-based limits (TBL) are an end-of-pipe approach that relies on available technologies to derive discharge limits. A TBL may be imposed in combination with other forms of regulation and are often imposed as interim limits to provide time for a utility to implement treatment solutions or explore alternatives to treatment for achieving more stringent requirements. The advantage of a TBL is that it is simple to define. It depends only on the present state of technology and therefore has widespread applicability.
One example of a TBL is the Bay View Water Reclamation facility which discharges treated effluent from Toledo’s lone WRRF into Maumee Bay, a tributary to Lake Erie. Like all major facilities in the Great Lakes watershed, the Bay View discharge permit includes a limit not to exceed a monthly average of 1.0 mg P/L or a weekly average of 1.5 mg P/L in treated effluent.
The disadvantage of a TBL is not based on the specific properties of a particular watershed and therefore, may not be sufficient to bring a watershed into attainment status.
Total Maximum Daily Load
A TMDL is a water-quality based standard applied to impaired watersheds. Nutrient enrichment is one of the most common causes of impairment (WEF Nutrient Removal). A TMDL is hence a nutrient diet for watersheds. An important distinction of a TMDL is that it is based on load and not concentration. (Learn more, Oregon's Tualatin River: America's Early TMDL Case Study). Each point source is assigned a portion of the total allowable load. The load restriction does not change as the facility expands such that the concentration of phosphorus in treated effluent must be reduced as flow increases. Thus, a facility must achieve greater levels of removal as flows increase. Another important distinction is that limits may be applied over a term longer than typical weekly or monthly limits, providing greater flexibility to offset periods of low performance with periods of high performance.
Water Quality-Based Effluent Limits
WQBELs have traditionally been applied to limit the discharge of toxic substances. Phosphorus and nitrogen are not toxic in the traditional sense – a specific concentration will not lead to a predictable response, e.g. mortality. Therefore, in order to facilitate standards development, USEPA released the report National Strategy for the Development of Regional Nutrient Criteria in 1998. Progress has been slow but nutrient water quality standards now exist in 23 states (view an interactive map, State Development of Numeric Criteria for Nitrogen and Phosphorus Pollution). Implementation of new standards varies by state but some very stringent limits for phosphorus are appearing in NPDES discharge permits. In Wisconsin, for example, treated effluent from WRRFs discharging to streams is limited to a maximum concentration of 0.075 mg TP/L. A compliance schedule of up to 9 years is provided to meet the new limit.
Phosphorus Monitoring
The two most common measurements of phosphorus in wastewater are Total Phosphorus (TP) and orthophosphate (OP). TP is typically the compliance parameter required by National Pollutant Discharge Elimination System (NPDES) discharge permits; while OP is a useful process control parameter. TP is measured following digestion of the sample with acid and heat but OP is not well defined, analytically speaking. OP is generally assumed to consist of dissolved reactive phosphorus (DRP) which may consist of compounds besides orthophosphate. (Learn more, Monitoring Orthophosphate for Reduced Chemical Costs in Wastewater).
>>> Download Reducing Total Phosphorus in Water Resource Recovery Facilities
DRP is measured as that portion of the sample that passes a 0.45 um membrane filter and can be measured using direct colorimetry. Lastly, there is non-reactive phosphorus (NRP). NRP occurs at a very low concentration. However, the proportion of NRP increases as the TP in treated effluent becomes lower because it is difficult to remove from wastewater.
Measurement Methods of P
Colorimetry is the most convenient analytical method for measuring phosphorus in wastewater. Multiple colorimetric methods exist but all are the same in principle: phosphate ion combines with ammonium molybdate under acidic conditions to form ammonium phosphomolybdate. In the “yellow” method vanadium in the reagent generates a yellow color in solution, the intensity of which is proportional to the phosphate concentration in the sample. The “yellow” method is the principle of measurement for the YSI IQ SensorNet P700 and most other online phosphate analyzers. (Watch, Alyza IQ Overview).
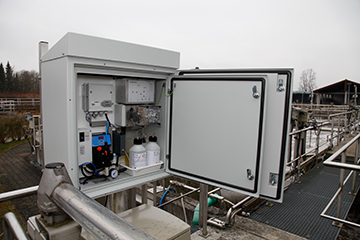
A different method, the “blue” method, is required for compliance-level measurements. In the “blue” method, tin and antimony in the reagent generate a blue color proportional to the phosphate concentration. The “blue” method has a lower method detection limit (MDL) and is generally considered more accurate than the yellow method. However, the chemistry requires the use of more complicated and expensive optics which increases the cost of the analyzer but is not warranted for process monitoring.
The aforementioned colorimetric methods are applicable only to dissolved phosphate. Sample preparation using chemicals and or heat is required to dissolve particulate phosphate. The digestion step is not a common feature of online phosphate analyzers because of the added complexity and cost. Therefore, compliance monitoring is almost exclusively done in the lab on grab or composited samples. The digestion step also increases the measurement time which increases analyzer response time limiting its application for process control.
What is the P700 and How Does it Measure?
The IQ SensorNet version of a phosphate analyzer is the P700 IQ orthophosphate monitoring system. The base model (item 8P-000Y) consists of a photometer, peristaltic pump, and reagent tray in a powder-coated IP54 aluminum enclosure which can be mounted on a handrail, on a wall, or is free-standing and runs off 115V power.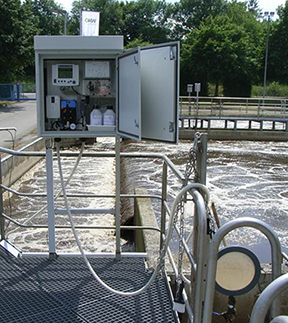 Most customers purchase the version that includes an integrated electric diaphragm sample pump (item 8P-010Y). A lightweight 0.45 micron filter (item 821 987Y) on a sliderail (item 821 986Y) is available separately. The maximum total suspended solids (TSS) for the filtration system is 6,000 mg/L. Competitive systems without filtration are limited to a maximum of 75 mg/L TSS which limits application to treated effluent. A version with a sample pump and climate package (item 8P-011Y) allows operation at ambient temperatures between -4°F and 104°F.
The P700 IQ features a wide measuring range, low reagent consumption, automatic calibration to a standard, and automatic cleaning. Two measuring ranges, 0.05 to 15 mg P/L, and 1 to 50 mg P/L are available for monitoring untreated wastewater, treated wastewater, or sidestreams. Competitive systems are limited to 15 mg P/L or less or only offer 1 measuring range with a resolution of 1 mg P/L. Automatic calibration to a standard and cleaning at user-programmed intervals provides assurance of analyzer performance and trouble-free operation. A manual 1 or 2-point calibration is also possible. Competitive systems only perform a zero adjustment and manual calibration is not possible. Reagent (vanadomolybdate solution in sulfuric acid) consumption is 1 x 2.5L bottle every 4 months at a 5 minute measurement frequency.
Chemical Removal of Phosphorus
Chemical removal of phosphorus has been utilized for decades. It is easily integrated into any configuration with the addition of facilities for chemical storage and feed. It starts working quickly and is easy to turn down or turn off. Chemical treatment is generally a good choice for WRRFs with one or more of the following characteristics: small flows (<0.5 mgd), extended periods of unattended operation, or discharge limits of 1.0 mg P/L or higher. For other WRRFs, the cost of chemical, chemical handling requirements, increased sludge generation, and fouling of quartz sleeves on UV disinfection lamps may offset the benefits forcing a hard look at biological P removal.
Both chemical and biological P removal methods are effective in converting soluble P into particulate P. The concentration of total phosphorus (TP) in treated effluent ultimately depends on the presence and function of settling and filtration steps. A well-functioning clarifier can remove down to 0.5 mg P/L; a conventional sand filter down to 0.1 mg P/L; and a membrane filter down to 0.01 mg P/L.
Chemistry and Mechanism of P Removal
Three classes of chemicals are used for chemical P removal: iron salts, aluminum salts, and lime (calcium). Precipitation of P with lime was one of the earliest chemical treatments. Lime is inexpensive and widely available. However, handling requirements and the high pH required have limited its present usage. Iron and aluminum salts are the most common chemicals used today.
Ferrous or ferric iron may be used. Ferric salts are more effective but ferrous is easily oxidized to ferric in aerated tanks. Waste pickle liquor, a by-product of steel processing, has been used extensively as an inexpensive source of the chemical. In the 1990’s the City of Toledo Bay View Water Reclamation Facility dosed waste pickle liquor, a by-product of steel processing, to the aerated grit tanks where it would be oxidized to ferric for greater effect. Variability in quality and heavy metal content has curtailed usage of pickle liquor in recent years.
Alum is the most common aluminum salt. Sodium aluminate and polyaluminum chloride (PAC) are more expensive but do not depress pH, an advantage for low alkalinity waters.
Understanding Chemical Removal
The understanding of chemical P removal with iron and aluminum salts is undergoing a makeover. The traditional understanding is an equilibrium precipitation model based on the formation of metal phosphates which are insoluble and can be captured by settling or filtration. The equilibrium model is convenient from a design standpoint because chemical dosage, sludge generation, and alkalinity consumption are all calculated from balanced chemical formulas. Full-scale plant data showing lower effluent P than predicted and experimental observations revealing that metal phosphate does not precipitate at the pH and P concentrations typically encountered in municipal wastewater treatment demonstrated flaws with the equilibrium model. An alternative model based on the formation of a hydrous metal oxide (HMO) precipitate is now coming into acceptance.

HMO Formation. Image Credit: Dr. Sam Jeyanayagam, CH2M Hill
Co-precipitation is the main P removal mechanism in the surface complexation model (SCM). Iron or aluminum salts react with alkalinity in water to form HMO precipitate with the variable capacity to adsorb soluble P. Mixing intensity at the point of chemical dosing is a critical factor limiting adsorption. The TP removal for a given dosage is limited by the amount of high-HMO generated at the dosing point.
A high mixing intensity generates a high proportion of HMO with high adsorptive capacity. High-HMO sorbs P instantaneously. Within moments of chemical addition, high-HMO precipitates grow and consolidate into flocs, changing to a form with low adsorptive capacity. A low mixing intensity, on the other hand, generates a higher proportion of HMO with low adsorptive capacity (low-HMO) increasing the chemical dosage required to achieve target P levels. Adsorption of soluble P to low-HMO continues until no adsorption sites remain. This may account for residual removal with return activated sludge, even when chemical feed is stopped. Chemical sludge recirculation has been engineered into the tertiary phosphorus removal system at Coeur d’Alene, Idaho to take advantage of the continued adsorption and reduce total chemical costs.
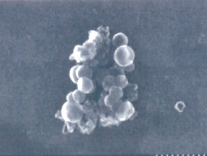
The growing flocs act like a fishnet to entrap non-settleable colloidal P and drag it down, a minor removal mechanism. Therefore, another benefit of high mixing is that it increases the contact between soluble P and HMO in the initial moments after dosing and thereafter increasing adsorption and entrapment of colloidal P in the growing HMO floc. (Baby Floc Shown in Image. Image Credit: Dr. Vladimir Kitaev, Wilfrid Laurier University)
Chemical Dosage Strategy
Early in my career, I came to believe that the most optimal chemical addition strategy was adding chemicals upstream from primary settling. My first experience with chemical P removal was as a college intern at Bay View. Pickle liquor was added to aerated grit tanks and P was removed with primary sludge in the primary settling tanks downstream, a strategy known as pre-precipitation. Ferrous was stored in three large, insulated, and heat-traced tanks inside a concrete containment. Pumps and a maze of piping and valves were located in an adjacent building.
One of my projects was to map the distribution system and create valve tags (documentation of its construction was lost or never existed). The wisdom, as it was explained to me, was that pre-precipitation resulted in fewer side-reactions and more efficient chemical use. Besides that, the addition of chemicals to secondary treatment increased the inert content of mixed liquor making it necessary to keep a higher solids inventory and increasing final settling tank loading rates.
Simultaneous precipitation is the most common strategy for WRRFs that do not have primary treatment. Chemical is added to the mixed liquor upstream from final settling tanks and P is removed with waste activated sludge (WAS). The final settling distribution chamber is a common dosing point. One YSI customer doses chemical just upstream of their oxidation ditch rotors.
Some facilities that do have primary treatment may also choose simultaneous precipitation for a more predictable and stable process. Some wastewater P may yet be converted to soluble form, a requirement for chemical P removal, in primary treatment. On the other hand, removing too much P in primary treatment can cause a P deficiency in downstream biological treatment. Using the same ratio as below, for a primary effluent BOD concentration of 100 mg/L, a minimum concentration of 1.0 mg P/L is required to support biological growth.
The Hampton Roads Sanitation District (HRSD) York River Treatment Plant utilized both pre-precipitation and simultaneous precipitation strategies in the mid-2000’s. A baseline amount of ferric chloride was added to primary treatment with additional ferric added to secondary treatment to achieve target effluent concentrations leaving a small amount of soluble P to support biological growth in downstream biological denitrification filters.
A multi-point chemical addition strategy, as in the HRSD example, is required to achieve the lowest effluent TP. The strategy may also include chemical addition to tertiary treatment, known as post-precipitation. Solids would be captured on sand filters or in tertiary clarifiers. Many facilities do not already have tertiary facilities so new construction would be required to implement post-precipitation.
Enhanced Biological Phosphorus Removal
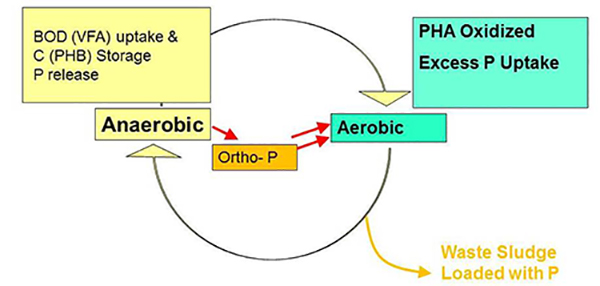
Supplemental biological P removal occurs by a process known as enhanced biological phosphorus removal (EBPR). EBPR is a more recent innovation than chemical P removal but is also now common. EBPR is implemented into the activated sludge process and P is removed with waste activated sludge (WAS). The potential for EBPR depends on successful cultivation of phosphate accumulating organisms (PAO) which require three conditions for growth: excess phosphate in the wastewater, alternating oxic and anaerobic conditions, and the availability of a particular type of organic carbon called volatile fatty acids (VFA).
In anaerobic conditions, PAOs can store their food (VFA) before eating it. In a similar way, I might stuff cookies that I cannot eat immediately into my pockets to eat later. People without pockets could be left out. The PAOs are people with pockets in this analogy. The VFA are packed into a storage product called poly-hydroxy alkanoates (PHA) and phosphate is ejected from the PAO into the mixed liquor.
PAOs consume the VFA using oxygen. Under oxic conditions (ORP > 100 mV), or possibly even anoxic conditions, the bacteria oxidize the stored carbon (VFA), replenish the depleted phosphate, and accumulate extra phosphate. The accumulated phosphate can be thought of as an investment. The more phosphate that is accumulated the greater the potential to thrive if the conditions are right. The PAOs become rich driving orthophosphate (OP) to nearly 0 and the particulate P (PP) content of mixed liquor is increased up to 8% or higher. If anaerobic conditions are not encountered or the amount of VFA is not sufficient, the investment in accumulated phosphate does not completely pay off and competing organisms which do not accumulate OP prosper limiting the PP content of the mixed liquor and possibly resulting in OP escaping in treated effluent. PP is removed with WAS.
Design and Operation of EBPR
Treatment configurations for EBPR include an upstream anaerobic zone in which DO and nitrate are very low. The recommended hydraulic retention time (HRT) of the anaerobic zone varies from 30 minutes to 2 hours depending on the characteristics of the wastewater and the design and operation of the treatment system. OP may be increased in the anaerobic zone by 3 times or more as PAOs release it to sequester VFA. Primary release of OP in the presence of VFA is desirable. Secondary release downstream, described below, is not desirable. The anaerobic zone may also need to accommodate fermentation of mixed liquor to generate VFA. It has been demonstrated that ORP needs to be -300 mV or less for fermentation to occur in wastewater.
OP uptake occurs in downstream oxic zones. The prevailing wisdom is that DO must be maintained at 2.0 mg/L or higher at the front end of the oxic zone following an anaerobic zone to achieve the greatest uptake. OP uptake occurs rapidly in the front end and tapers off moving downstream. Recently, this wisdom has been challenged as substantial P removal has been observed in simultaneous nitrification-denitrification facilities operated at relatively low DO concentrations.
EBPR is More Complicated than Chemical P Removal
Practitioners have identified several prerequisites for achieving reliable performance. A consistent and adequate supply of VFA is very critical. Variable and insufficient VFA stress PAOs and allow other organisms (or other metabolisms) which do not result in accumulation of P to flourish. WRRF that are required to also transform or remove nitrogen may need to add an external source of carbon. Simple and inexpensive methods for continuous monitoring of VFA do not presently exist. However, online monitoring of soluble COD and dissolved organic carbon (DOC) is possible with an optical spectral sensor and can be beneficial to optimize the use of wastewater carbon and minimize the use of external carbon.
Integrity of the anaerobic zone is also important. DO or nitrates will interfere with P release. For this reason, the DO in downstream oxic zones should be minimized to prevent carryover of DO with return activated sludge (RAS). Nitrification will increase the concentration of nitrate in the RAS. The purpose of a pre-anoxic zone upstream from the anaerobic zone in some configurations is to denitrify return activated sludge (RAS). In other configurations, denitrified mixed liquor is recirculated upstream to mix with raw wastewater.
Efficient operation of solids separation systems is essential to prevent captured particulate P from escaping in the effluent. The P content of EBPR sludges can be 10% by mass or higher. The effluent PP in 10 mg TSS/L is 1.0 mg/L for a P content of 10%. Continuous monitoring of downstream effluent TSS can provide an early indication of upsets and provide a signal to start polymer addition, for example. Monitoring of upstream MLSS can allow fast calculation of solids loading and a signal to switch to step feed operation.
OP previously sequestered by PAO can be released downstream, increasing effluent TP. Secondary release occurs when mixed liquor becomes anaerobic in deep final settling tank blankets or during sludge treatment. Minimizing sludge blanket depths can prevent secondary release in final settling tanks. P can be removed from sludge handling recycle streams by chemical treatment or by installing a struvite recovery system.

Additional Blog Posts of Interest
Monitoring Orthophosphate for Reduced Chemical Costs in Water Resource Recovery Facilities
The Phosphorus Problem: Wastewater Treatment Options and Process Monitoring Solutions