Water Quality Monitoring with Rhodamine
(Updated November 2021)
The YSI Rhodamine sensor increases my excitement about the expansion of the EXO platform and this excitement is shared by customers who loved having a Rhodamine sensor on YSI’s 6-series sonde platform, and really wanted one for EXO. Some others, however, give me a quizzical look and say “What’s that for?”
It’s not the first time that I’ve been eager about something that not everyone else fully appreciates. I’m that Aunt that talks about harmful algal blooms at Christmas dinner, after all. But this sensor is a real innovation—not just a knockoff of the old sensor or of our competitors’ sensors and not, as some have proposed, just a re-labeled EXO Total Algae Phycoerythrin (TAL-PE) sensor. Let’s first answer the “What’s that for?” question, and go on to show a real-world dye tracer study (Figure 1) shared with us by the Alabama Department of Environmental Management (ADEM). For those who seek a deeper understanding, I’ll reveal some of the mechanics of how the EXO Rhodamine sensor works.
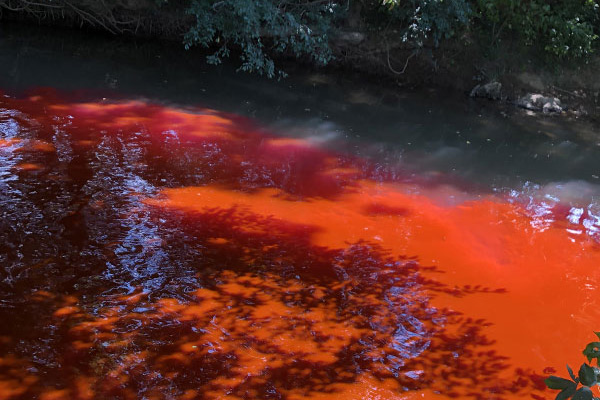
Figure 1: Rhodamine WT in Big Wills Creek, Alabama, photo by YSI's Lisa Landry.
What is Rhodamine?
There is more than one type of Rhodamine dye, and the specific dye of relevance here is Rhodamine WT, where the “WT” stands for “water tracer.” Rhodamine WT is distinct from Rhodamine B, for example, because Rhodamine WT (RWT) is water soluble. Quite conveniently, RWT is a fluorescent xanthene dye, facilitating highly sensitive detection with a fluorometer when it is dissolved in water. RWT is also very stable in water (relative to most fluorescent dyes, that is), and is safe for humans, wildlife, and plant life in low concentrations. It is so accepted for outdoor use that the US EPA has SOPs for its use in dye tracer studies, and specifics on RWT can be found at the EPA’s Substance Registry Service online.
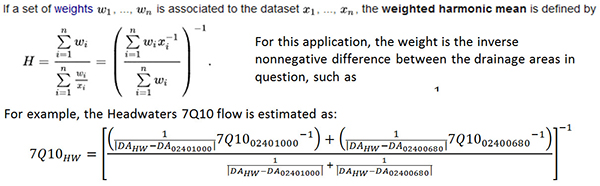
To appease the chemistry gods, Table 1 summarizes the dye’s properties, and you can go into even more chemistry madness at PubChem (ID No. 37718):
| Solubility in Water |
18-22% w/v |
| Half Life in Water (photolysis) |
Temperature-dependent: 15.3 days (4.77x10⁻²/day) and 21.9 days under natural sunlight in winter (3.16x10⁻²/day), at 30 deg north (Tai and Rathbun, 1988, Chemosphere 17:559). |
| Excitation/Emission Wavelength Peaks |
558/583 |
| Molecular Weight |
567 g/mol |
| Extinction Coefficient |
87000 M-1cm-1 (Tai and Rathbun, 1988) |
Table 1. Properties of Rhodamine WT.
If chemistry isn’t your happy place it might not be immediately clear why some of these properties matter. The solubility is clearly advantageous for making a 20% solution, often what is used to kick off a tracer study. Once released the dye will degrade through photolysis at a rate that is temperature-dependent. But it doesn’t degrade so fast that it can’t be used for a multi-day, or indeed multi-week, study. The high extinction coefficient translates to the ability to detect very small traces of RWT, a boon if you’re in the sensor business. Sensor development is further facilitated because the dye is fluorescent, in this case “excited” by light of a wavelength on/around 558 nm, and emitting light on/around 583 nm. So as RWT is diluted, it can be detected over a very, very wide range of concentrations, making it perfect for large-scale tracer and breakthrough studies. The molecular weight matters because…well I guess I’m an old-school microbiologist/biochemist and such habits die hard. You can’t talk about a chemical’s properties and not include its molecular weight!
But did I mention that it is cheap? $215/lb doesn’t sound cheap when compared with, say, a pound of bacon. However, as far as fluorescent dyes go, this one’s a bargain, and given its years-long stability when stored in the fridge as a concentrated solution (unlike that bacon), it’s a sound investment if you’re going to do a large-scale project dumping it into a river (please don't do that with bacon).
Thus the combined solubility, stability, safety, detectability and affordability are the reasons RWT has been used for decades in outdoor water studies.
There are so many possibilities for Rhodamine to be used in surface water, ground water, and wastewater applications that it’s hard to come up with a complete list: time of travel (ToT), dispersion studies, discharge measurements, waste buildup and flushing in estuaries and bays, wastewater retention and flushing in wetlands, combined sewer overflows (CSOs), circulation and stratification in reservoirs, to name a few! A great literature review of applications for Rhodamine, including a good explanation of things one shouldn’t conclude from such studies, is provided by Runkel (2015, Water Resources Research 51:6125). I strongly recommend that Rhodamine enthusiasts familiarize themselves with Runkel's writeup when planning their studies.
ToT is by far the most common application for YSI’s customers, and I’ve excerpted some key points from data shared by the Alabama Department of Environmental Management (ADEM) below.
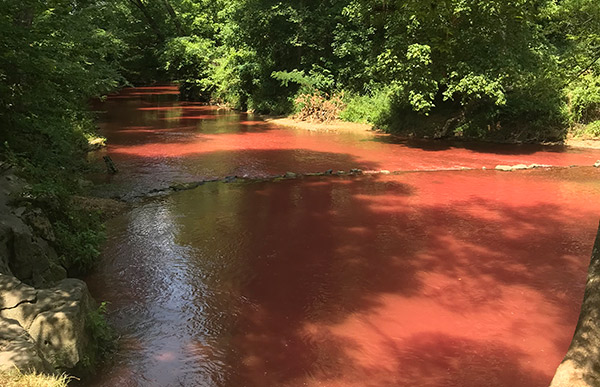
Rhodamine dye dispersal in Big Willis Creek. Photo Courtesy: ADEM
Crimson Tide ADEM-Style
In 2019, while the EXO Rhodamine sensor was in its beta testing stage, ADEM was about to embark upon a ToT study, and collaborated with us to collect some data with the new sensor. In July and September, ADEM’s Matthew Revel and David Thompson carried out the study, and YSI’s Lisa Landry, our Gulf Coast representative, was invited to participate.
ADEM’s aim was to develop a calibrated water quality model that would help them to develop Waste Load Allocations (WLAs) for various water treatment plants and industries along Big Wills Creek. WLAs are implemented in the National Pollutant Discharge Elimination Systems (NPDES) permits issued to the dischargers by ADEM in accordance with Section 402 of the Clean Water Act. ToT studies help ADEM develop WLAs that are protective of Alabama's waterways.
ADEM's study took place in both July and September. In July there was a mix of 6-series sondes with Rhodamine sensors, EXO sondes with TAL-PE sensors, and EXO sondes with the beta unit Rhodamine sensors. In September the 6-series sondes were not used, only the EXOs with TAL-PE and Rhodamine sensors. TAL-PE sensors were used because we knew that they might work for ToT studies under some circumstances, even though they weren't optimized for this purpose the way the Rhodamine sensor is.
To keep things manageable we’ll focus on September and data collected for monitoring stations along ~37 miles of Big Wills Creek. I’ve labeled these stations A through I, where A is the most upstream station and I is the farthest downstream, and three stations (D, E and I in red) employed the Rhodamine sensors while the rest used the TAL-PE sensors (Figure 2).
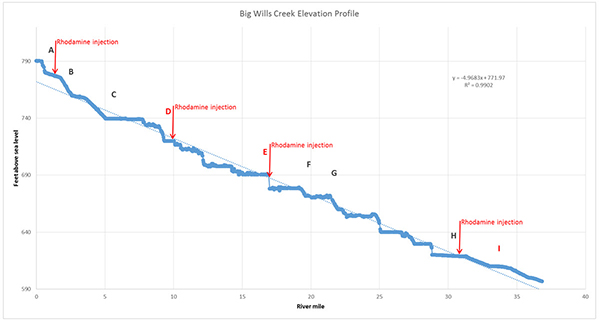
Figure 2. Elevation profile for sampling stations A through I of Big Wills Creek, courtesty of ADEM.
Figure 2 shows that there were four points where Rhodamine was injected into the River.
The Rhodamine comes to the sonde as a plume that is dispersed as it goes downstream. I compiled the data for Stations B, C, and D to demonstrate this in Figure 3. As you can see, by Station D the plume has become quite spread out and the Rhodamine is at a much lower concentration at the peak. That’s why, in the profile shown in Figure 2, an injection point immediately follows Stations D, E, and H. The Rhodamine would be untraceable by Station E, if only Station A injection had occurred.
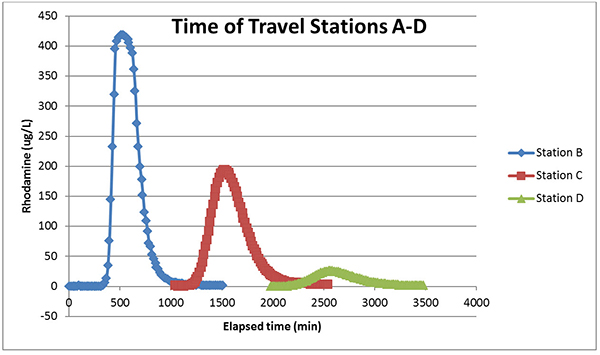
Figure 3. The Rhodamine data from the EXO2 sondes bearing TAL-PE (Stations B and C) and Rhodamine (Station D) sensors.
In Table 2 you will see the miles between the sondes and the calculated Centroid ToT and velocity. In case you were, like me, naïve enough to have assumed that what you would measure in these studies is basically the first detection of RWT, and then just use the distances between two points to estimate the time of travel, dust off your calculus and join me for a moment.
Because RWT travels as a dynamic plume a ToT study employs what is called the centroid time and centroid velocity. The centroid is, sort of, the center of that not-perfectly-shaped plume (bear with me hydrology folk, I’m a microbiologist). To find those centroids one performs an integration of the data from Figure 3, and the rate at which the plume is traveling can be computed. Such data are shown in Table 2.
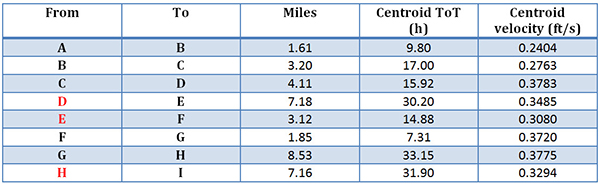
Table 2. Distance and flow characteristics of the Big Wills Creek sites.
Consider the value of this information if you’re concerned about a discharge of a pollutant or even a perfectly legal discharge at one of these stations, and you need to estimate when that discharge will reach a spot downstream where, perhaps, a dialysis clinic draws its water. While your estimate will not be exact because of things like the density of the material discharged, weather, water levels and flow, you’ll be in much better shape than you would be without the data for planning your response.
Speaking of flow, I recall happier times, like 4 days ago, when I really didn’t think about the definition of flow, and thought it was basically a rate like m/s or as simple as that centroid velocity in Table 2. Early March 2020 was when I thought an answer to the question, “How fast is that river flowing?” might be, “Oh, about a meter per second.”
Yeah, that’s wrong. I was aware that I didn’t fully understand flow and discharge because of some of my prior conversations with USGS customers and Sontek colleagues (both of whom are welcome to make fun of my ignorance), but looking at ADEM’s report gave me a whole new respect for the complexities of streamflow discharge measurements. “Flow” (Q) is a volumetric parameter with units like cubic feet per second, and ADEM’s draft report contains atrocities like this:
So I’m learning a lot, which is why I write these blogs anyway. Mercifully my aim here is to talk about the sensors, so we aren’t going to go into ADEM’s flow models here. Suffice it to say—they got the information they needed to accomplish their objective for NDPES-related monitoring.
Returning to the sensors, the TAL-PE sensors performed quite admirably in this study. Figure 4 zooms in on the data from Station C, where the PE channel of the TAL-PE sensor looked pretty great.
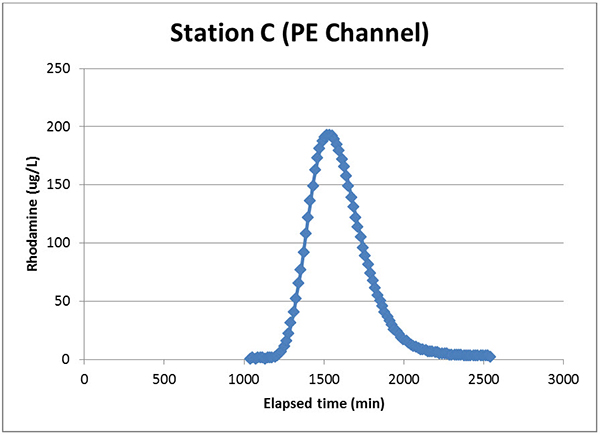
Figure 4. Data from the EXO TAL-PE sensor’s PE channel at Station C.
Note here that the TAL-PE sensor doesn’t actually report Rhodamine µg/L units (y axis). Rather it yields relative fluorescence units (RFU) or pigment µg/L. ADEM’s scientists had to convert that output to Rhodamine units by manually building that correlation first. Not too hard of a task—it’s a pretty linear relationship across the range of this sensor—but this is one of the hurdles of using the TAL-PE sensor for ToT studies.
Now let’s look downstream where stuff starts getting pretty dilute (Figure 5). Curves get a little rockier in these low ranges when using the TAL-PE sensor, and ADEM had to start using the chlorophyll channel rather than the PE channel to get the most usable data. If you need a refresher on these two channels, take a look at the How Algae Sensors Work webinar. This also occurred in July, and in general when Rhodamine concentrations dipped into the 20s, they switched over to the chlorophyll channel of the TAL-PE sensor. Again, this is not too hard of a task, as long as both channels were properly calibrated. They could select which channel’s data to use during their analyses, because the sonde is collecting the data anyway.
Note also in Figure 5 that the chlorophyll channel doesn’t flatline at zero. This may be because it is detecting something else in the water (maybe algae?), or is just noisy at such low ranges that correlate to Rhodamine concentrations below 0.5 ppb, or maybe if we traced that tail farther to the left it might be flat. The data available did not suggest the latter possibility, and we see this tail noise sometimes in other chlorophyll channel data sets when the TAL-PE sensor is used for Rhodamine WT tracking.
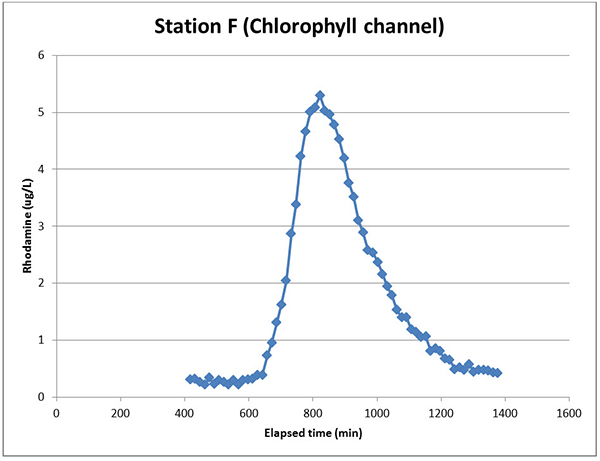
Figure 5. TAL-PE sensor data using the chlorophyll channel at Station F.
By contrast, consider the data from Station D, which we saw in Figure 3 but can examine in nice detail below in Figure 6. The EXO Rhodamine sensor doesn’t require channel switching to get good low-range data, and its leading peak tail is flat at zero (the lagging tail wasn’t traced out farther). This is typical of what we have observed so far with this sensor.
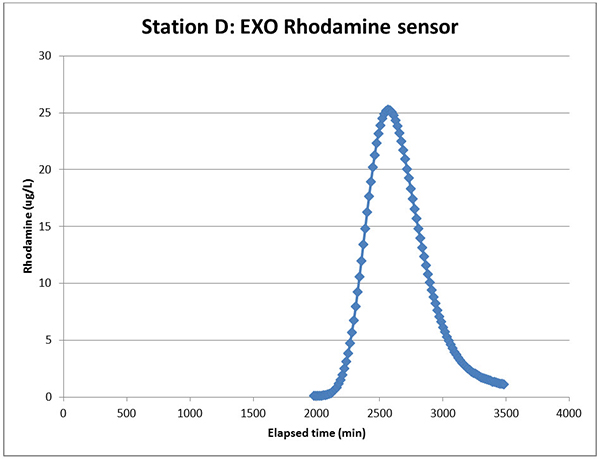
Figure 6. The EXO Rhodamine sensor data at Station D.
These differences are pretty subtle in the ADEM study, and one does have to wonder whether using a TAL-PE sensor is good enough for most studies. Certainly if I had a batch of TAL-PE sensors, I wouldn’t rule them out as tools for a ToT study, if your water is generally algae-free. Other types of studies might require better low-range detection or better performance to a very high range, up to 1000 µg/L RWT. This is beyond the capacity of the TAL-PE sensor.
But…we did start with the TAL-PE sensor when we embarked upon the development of the EXO Rhodamine sensor.
The EXO Rhodamine Sensor: What’s Inside?
Back in 2016 we didn’t intend to make an EXO Rhodamine sensor and asked a collaborator at ADEM to try a ToT study with a TAL-PE sensor we loaned him (Figure 7). In this case an EXO2 sonde bearing a TAL-PE sensor was placed side-by-side with one of their 6-series sondes and the Rhodamine sensor from that platform.
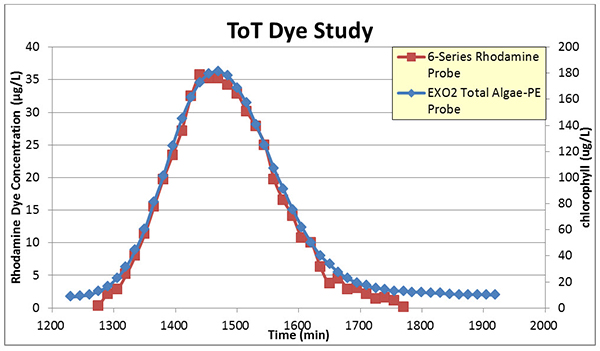
Figure 7: ToT using 6-series Rhodamine and EXO2 TAL-PE sensors.
At first glance, it appears that the TAL-PE sensor overlaid the 6-series Rhodamine sensor’s output pretty nicely! However, based on his experience with time-of-travel (ToT) studies our collaborator still said he wanted a dedicated Rhodamine sensor for the EXO platform.
Once again notice the axes—the TAL-PE sensor didn’t contain the firmware to put out an actual value of RWT—the sensor thought it was detecting algal pigment (chlorophyll). So the output is in pigment µg/L (right axis). That doesn’t mean that all we did was change the firmware to spit out a Rhodamine unit and etch a new label to make the EXO Rhodamine sensor, however.
Notice in Figure 7 that the TAL-PE sensor “bottomed out” somewhere between 1-2 ppb on the Rhodamine scale (the left axis). This is similar to what we saw in Figure 5 above. TAL-PE also produced a signal sooner in time than the 6-series sensor, and showed activity well later than the 6-series sensor. The TAL-PE sensor was probably detecting something other than Rhodamine up until ~1280 min, when the 6-series sensor started to “see” Rhodamine WT in the water, too. The same can be said after ~1775 min, again around 2 ppb on the RWT scale. The TAL-PE sensor simply couldn’t resolve RWT from whatever else it was seeing.
What was the TAL-PE Sensor seeing down there at 1 ppb? Maybe algae, interfering with its ability to go any lower than 1 ppb. It really doesn’t matter, because what does matter is that, based on the better sensitivity of the 6-series sensor and it’s time-based signal, it’s not likely RWT. This is an issue of specificity, because the TAL-PE sensor is not optimized for detecting RWT.
But we didn’t want to completely disregard that there were elements of the TAL-PE sensor that we could leverage to shorten the development pipeline.
The hardware of the EXO Rhodamine sensor (Figure 8) looks almost identical from the outside to that of the TAL-PE sensor. Inside, also like the TAL-PE sensor, it contains both a green and a blue LED. This brings us to a question I’ve been asked about the EXO Rhodamine sensor, which regards the “wavelength” of the LEDs. People ask this because they want to know if the Excitation/Emission pairing on the sensor overlaps with other tracer dyes of interest, especially fluorescein.
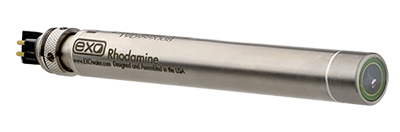
Figure 8. The EXO Rhodamine Sensor.
The EXO Manual has the specification table for the Total Algae sensors (Section 4.21 at the time of this blog), where one can see that the chlorophyll channel employs a blue LED with its emission peak wavelength of 470±15 nm, and the PE channel uses a green LED with an emission peak wavelength of 525 ± 15 nm. The detector filter enables emission wavelengths with a peak at 685 nm (this happens to be the emission optimum for chlorophyll, as explained in this webinar) to reach the photodiode. Consider Table 1 at the beginning of this blog, which showed that the excitation and emission wavelengths for RWT are 558 and 583 nm, respectively. How can we reliably detect RWT with the blue and green LED we have to work with, then?
We scientists like to view fluorescence in this very defined manner of bandwidths around Excitation/Emission pairs, but I’ve come to learn that engineers, particularly optical engineers, don’t “see the light” the way we do. Like us they consider filters that can be applied to the emitting LED, but they also consider the power that can be driven through the LED, and filtering of data that reaches the photodiode.
Our engineers chose a blue LED that would facilitate a different level of power going through it for exquisite sensitivity, and they “retuned” the blue and green LED paths for low-range detection of RWT and high-range detection of RWT by altering the power driven through both LEDs. Further, they altered the filtering to the photodetector to be more specific for the emissions from RWT.
Other key changes are in the algorithms and “electronic filters” on the data. Now is a good time to remind readers of a key point that I made in 2019’s webinar about How Algae Sensors Work: hardware is only part of the story. For many sensors the real magic happens with the embedded software in the sensor, called the firmware. This is where YSI’s engineers do the work that most of us don’t think about: the averaging of an ongoing stream of values, the adjustments of signal to noise ratios, tinkering with amplitudes and frequencies of multiple signals both external and internal to the sensor, and other proprietary “tweaks.”
So in effect, rather than a dual-channel sensor like the TAL-PE, The Rhodamine Sensor is a dual-LED, single-channel sensor, since it is detecting one primary analyte, RWT. The question of “peak wavelengths” is not one with a straightforward answer because the sensor chooses which LED’s data it will use on the fly. A more complete answer would unfortunately reveal proprietary information. Thus the specification table for the Rhodamine sensor doesn’t have this information like you would find for some of our other fluorescence-based sensors (Table 3).
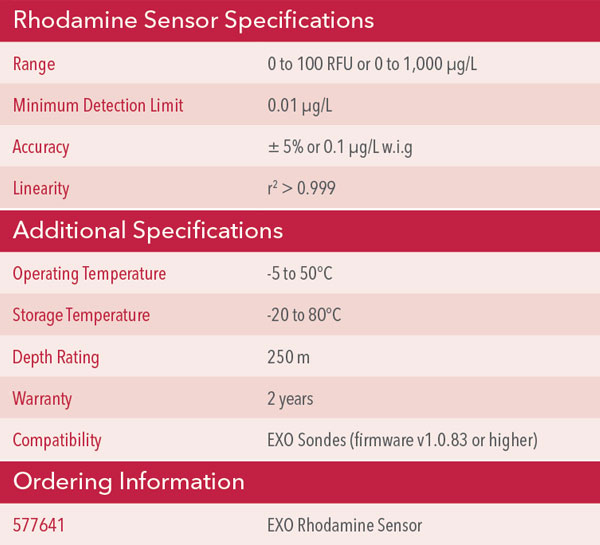
Table 3. Specifications for EXO Rhodamine sensor.
Lastly, why didn’t we just pluck the 6-series guts and update them for EXO? Well you can blame that on the product management team. We wanted the best combination of range and resolution in the industry, and that’s what R&D delivered. The result is that the EXO Rhodamine sensor has 5X the range and 10X the resolution of the 6-series Rhodamine sensor, along with all the other benefits of the EXO platform. You can also blame it on the fact that the 25+ year old components of the 6-series are not readily available!
In closing, there is considerable innovation in the EXO Rhodamine sensor, and if you are not already using a TAL-PE sensor for other applications, or if the TAL-PE sensor doesn’t offer the specificity and range you need, EXO Rhodamine is the right choice.
Maybe I should plan on talking about this over dinner during the upcoming Christmas?

Additional Blog Posts of Interest
For the Love of Charles | A River on the Rebound
Three Wrong Assumptions About Water Quality Monitoring
5 Tips to Prevent Costly Mistakes with Your Water Quality Sondes