Solving False Monitoring Echoes with Radar Mapping
Let’s face it – the perfect field site for monitoring water level is few and far between. Tree branches, riverbanks, or other obstacles often times block radar sensors from detecting clear water level readings and result in poor data quality. That’s the bad news! The good news is that radar technology has taken a leap forward in recent years to tackle this lingering issue. That’s why we are excited to tell you a little about a helpful Radar feature called mapping. 
Understanding Mapping
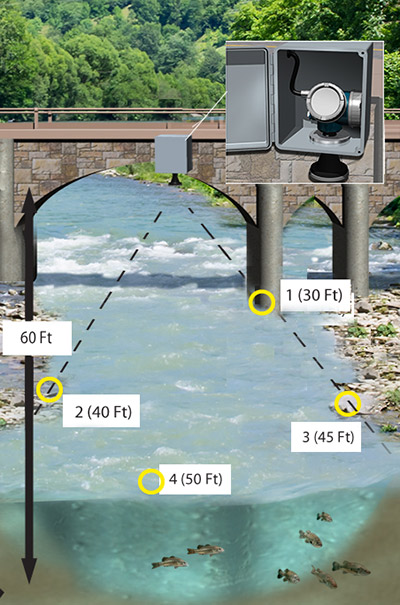
The mapping feature of a Nile Radar sensor allows you to program the instrument to understand which data points are not an accurate reflection of the current water level (and to ignore/eliminate), and which to record. Refer to the image on the right as an example.
In this image, the sensor is mounted on a bridge, monitoring the stage of a river. As the beam leaves the cone (shown by the dashed line), there are multiple surfaces detected.
At point #1, the radar hits the bridge at a distance of 30 feet.
At point #2, it hits the river bank at a distance of 40 feet
At point #3, it also hits the opposite side of the river bank at 45 feet.
Finally, it reaches the actual surface of the water shown at 50 ft.
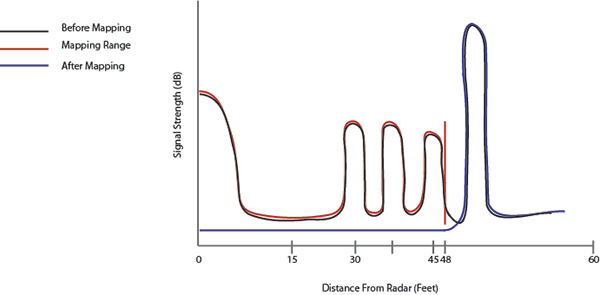
The graph below shows the data before enabling the mapping feature (black line), the mapping range (red line), and the results after mapping out interferences (purple line). Data at 50 feet shows the true surface water reflection, and mapping helps the Radar learn the path to the surface of the water, eliminating any other obstacles, and cleans up our data points.
So How’s it Work?
We tell the radar to what distance it will map. The radar sees and records all of the reflections to the distance that we specified. That is why we map to a few feet above the water’s surface. Now the radar has recorded all of the false reflections up to a few feet above the water’s surface. Those false reflections are removed mathematically. The radar takes the two signals (shown by the black and red lines in the graph) and subtracts them from each other resulting in the blue line. We are now left with clean data showing an accurate recording of water level.

The Mapping Process with the Nile LCD
Our applications engineers have put together a technical note to walk you through the process of how to do mapping on your Nile Radar display and we encourage you to check it out to ensure you are collecting the highest quality data possible!


Additional Blog Posts of Interest
Real-Time Water Quality Data Used to Protect Ecosystem During Dredging
Technologically Advanced Amazon Bubbler for Long-Term Level Monitoring
Flow Monitoring Helps Officials at Three Gorges Dam
Irrigation District Relies on Continuous Water Usage Information