Glucose Analysis Comparison | YSI 2900C Biochemistry Analyzer and 2300 STAT PLUS
The YSI 2300 STAT PLUSTM D-glucose (glucose) and Lactate Analyzer is a discontinued Class II in-vitro diagnostics (IVD) medical device widely accepted as a method for reference measurements and system calibration by most manufacturers of blood glucose (BG) monitoring systems.
YSI has developed a new generation analyzer, the YSI 2900C Biochemistry Analyzer, employing the same biosensor technology as the YSI 2300 STAT PLUS but with updated usability features and form factor.
This blog details the findings from a comparative study to evaluate the accuracy and precision of the new YSI 2900C Biochemistry Analyzer platform for whole blood (WB), plasma, and serum.
Methods
To assess comparability and analytical performance, blood samples were taken from volunteers by an on-site phlebotomist.
All samples were tested within a 4-hour period from the blood draw event. The analysis was made on whole blood (WB), Fingerstick Capillary WB, plasma and serum on three YSI 2300 STAT PLUS units, as well as three YSI 2900C Biochemistry Analyzer units. All units tested glucose over a range of glucose levels and hematocrit (% red blood cells in WB).
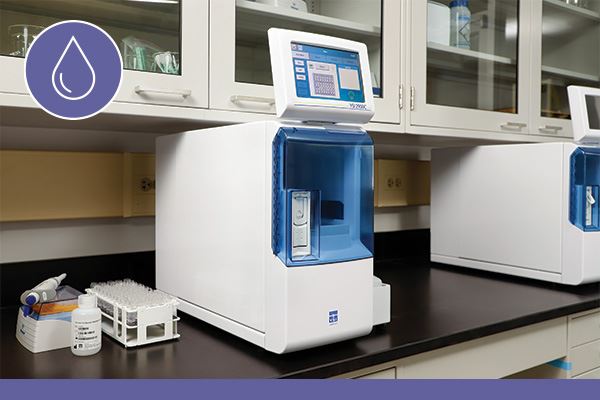
The YSI 2900C Biochemistry Analyzer is an FDA-cleared 510(k) device for blood glucose analysis.
Results and Discussion
Daily Membrane & Linearity Checks
All instruments utilized for the study were required to pass daily performance checks prior to analyzing samples. For acceptable glucose oxidase membrane integrity, a Ferrocyanide (FCN) test value of ≤ 5 mg/dL apparent glucose is required. FCN values for all membranes were well below 5 mg/dL, indicating structurally intact membranes.
The acceptable range for the 900 mg/dL glucose linearity standard is 855 - 945 mg/dL, which is ± 5% of the linearity check point. All instruments met the linearity specifications for each day of testing.
Data
The data presented here is a glucose assay from whole blood. Similar data was collected for plasma, serum, and fingerstick capillary whole blood. These were assayed in both the YSI 2300 STAT PLUS and the YSI 2900C Biochemistry Analyzer. In Plot 1 below, the x-axis is always considered the reference assay (output from the predicate device YSI 2300 STAT PLUS) and the y-axis is always considered the blood glucose monitoring system (output from the YSI 2900C Biochemistry Analyzer).
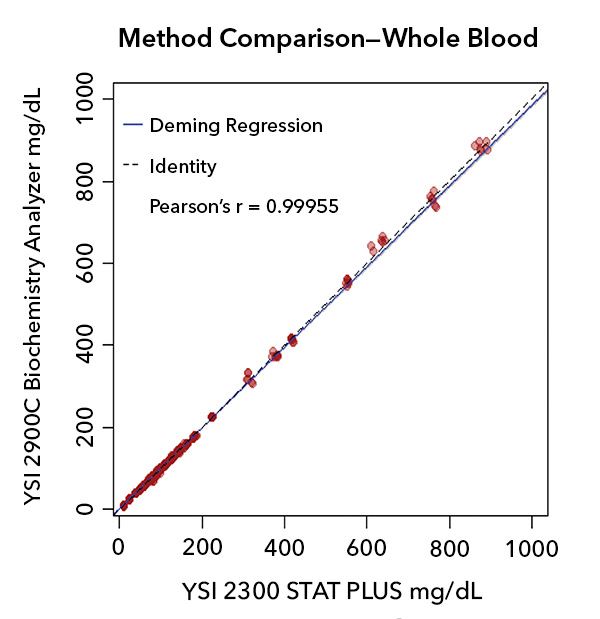
Plot 1. Data pairs over the whole range of D-glucose values tested in whole blood.
There are a few other things to consider with Plot 1:
- A (1/X2) Weighted Deming fit was used as the regression model. The weighting was used to compensate for leveraged bias due to the increasing variance (heteroscedasticity) over the range of the data.
- The shaded area around the regression line shows the 95% confidence interval (CI) around the slope and intercept of the model. The bootstrap technique was used to calculate the CI.
- Data are from 111 unique clinical samples.
- Data pairs are (YSI 2300 STAT PLUS, YSI 2900C Biochemistry Analyzer) in mg/dL Glucose.
Experimental Data-Whole Blood
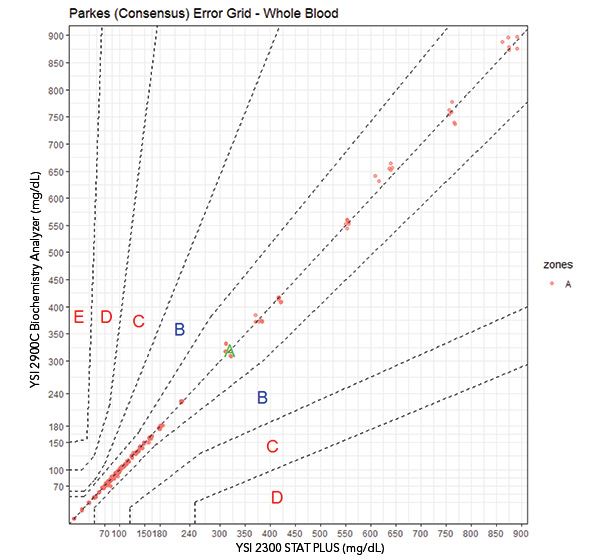
Plot 2. Error grid analyses. Parkes1 (Consensus) EGA. In the PEG, all points are within risk zone A. All Parkes EGAs shown are for Type 1 Diabetes. Data points above 450 or below 50 mg/dL were not available in the native samples; these were contrived by spiking or dilution.
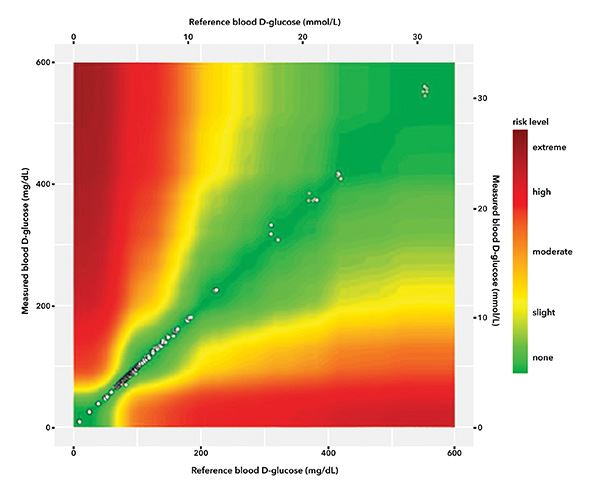
Plot 3. Error grid analyses. Surveillance2 EGA.
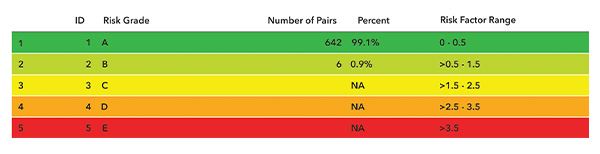
Table of data per risk grade in SEG. The Parkes EGA plot is shown because it covers the range of measured data whereas the SEG is bounded at 600 mg/dL.
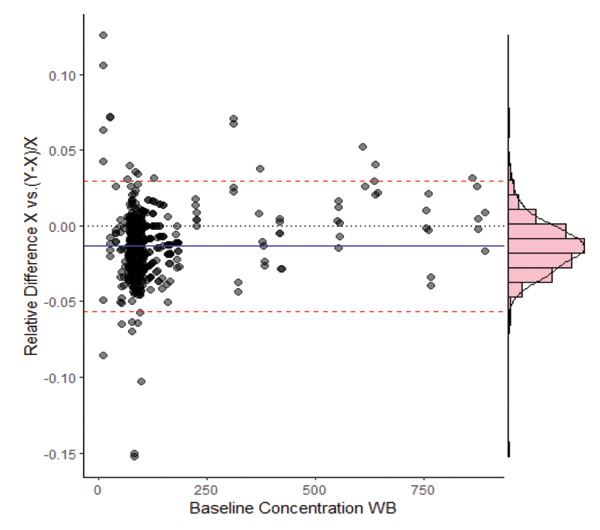
Plot 4. Relative difference plot for the comparison study data points covering the measurement range of D-glucose in whole blood.
There are a few other things to consider with Plot 4:
- Mean and ±2 SD values are calculated from the displayed range of values. This (variant of Bland-Altman) plot of YSI 2900C Biochemistry Analyzer vs YSI 2300 STAT PLUS displays limits of the agreement interval (±2 SD) well within the published specifications.
- This level of relative difference bias of -1.3% in performance is very unlikely to cause any adverse impact in the medical decision relevant range.
Summary and Conclusion – Comparability
Summary
This study was done to gain a comparative performance description between the predicate instrument, YSI 2300 STAT PLUS and the YSI 2900C Biochemistry Analyzer. Data pairings were plotted, and the comparison described by a Deming weighted regression model, allowing for error on both axes. More than 99% of all the data pairs compared were within zone A of clinical risk for all bloodrelated matrices tested, for the whole range of glucose concentrations.
Conclusion
The YSI 2900C Biochemistry Analyzer, performance was equivalent or better when compared to the predicate device, the YSI 2300 STAT PLUS for all four sample matrices tested. In conclusion, this study demonstrates the YSI 2900C Biochemistry Analyzer’s ability to be an acceptable replacement for the YSI 2300 STAT PLUS as an In Vitro Diagnostic Device.
Do you have a question about the new YSI 2900C Biochemistry Analyzer? Book a free virtual consultation today!

Sources
- Parkes, Joan L., Pardo, Scott, Slatin, Stephen L., and Ginsberg, Barry H., “A New Consensus Error Grid to Evaluate the Clinical Significance of Inaccuracies in the Measurement of Blood Glucose”, Diabetes Care, Vol. 23, No. 8, pp. 1143-1148, August 2000.
- Klonoff, David C. et al., “The Surveillance Error Grid”, Journal of Diabetes Science and Technology 2014, Vol. 8(4), 658-672.