Flood Monitoring

The Unyielding Force of Flooding

While water is essential for life, its overwhelming presence in the form of floods can wreak havoc on communities, infrastructure, and the environment.

From the gradual encroachment of riverbanks to the battering surges of coastal storms, flooding represents one of Earth’s most common and impactful natural disasters—flooding can occur nearly anywhere! Aside from wildfires, it is the most widespread natural disaster.1

flooding natural disaster warning
Flooding is one of the most common and destructive natural disasters on earth

What Causes Flooding?

In general, flooding occurs when water accumulates on the Earth’s surface faster than it can be absorbed, causing it to overflow onto land that is not normally underwater.

Prolonged or Intense Rainfall

Rainfall can cause flooding in various ways, such as persistent rain for an extended period (e.g., several days) and short—but incredibly intense—bursts of rain.

Tropical cyclones are notorious for dumping massive amounts of rain, but another hazard associated with these weather events causes devastating flooding—storm surge. See the section Coastal Flooding and Storm Surge for more information on tropical cyclones—including how they’re classified—and storm surge.

Wildfires

Severe flooding can also occur on land destroyed by fire. Wildfires can leave the land void of vegetation and the soil hydrophobic; it can take up to five years after a wildfire for vegetation to return.2

When rain falls, water runs across the Earth’s surface—rather than being absorbed—and picks up debris from the fire, resulting in dangerous mud and debris flows that can destroy homes and infrastructure. For example, a Presidential Disaster Declaration was made in 2011 after heavy rains fell on over 150,000 freshly burned acres in New Mexico.2

Learn more about the impact of wildfires in our Watersheds & Wildfires infographic from Mission: Water issue #7!

flood conditions wildfire soil hydrophobic
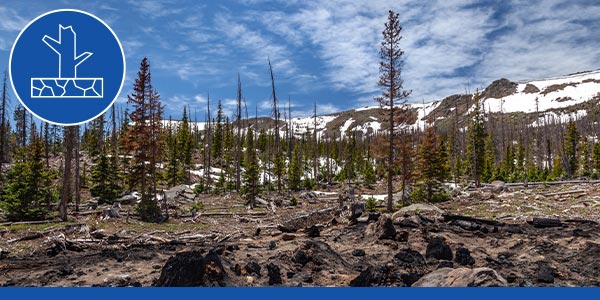
Wildfires cause the soil to become hydrophobic. When rain falls on the charred landscape, flood conditions can result because water cannot be absorbed into the ground.

Snowmelt

Snowmelt flooding naturally occurs in the spring when the winter snowpack melts in mountainous regions. It is ideal for the snowpack to gradually melt, but unusually warm air temperatures in the spring and rainfall on the snowpack—termed a rain-on-snow melt event—can result in dangerous flood conditions.3

Climate change has driven more frequent rain-on-snow melt events in different parts of the world, including Alaska and the Balkan regions of Europe.4 In December 2020, a significant rain-on-snow event resulted in flooding and landslides that impacted 1/3 of all residents in Haines, Alaska.5

Learn more about Earth's natural water towers in our snowpack infographic from Mission: Water issue #9!

Ice and Debris Jams

The spring thaw can cause other issues beyond snowmelt. Ice moving downstream can become lodged behind an obstruction—such as a bridge—resulting in water buildup behind the chunk of ice. Once it gives way, a sudden surge of water can be released, resulting in flooding downstream. This phenomenon can occur any time of the year with forest debris or even logs caught in rivers or streams.3

flood monitoring ice debris jam
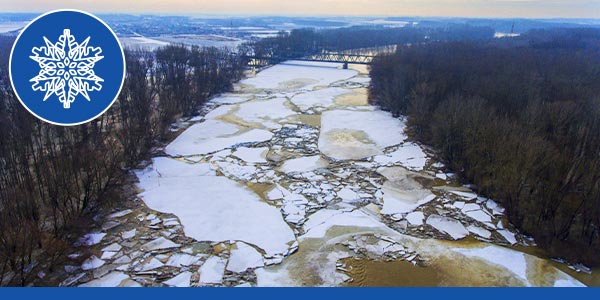
A sudden surge of water can be released downstream when an ice or debris jam finally breaks free.

Dam or Levee Failure

Similar to the release of water from an ice or debris jam, the sudden failure of a dam or levee can result in a massive pulse of water being released downstream, resulting in devastating flooding. This type of flooding is perhaps the worst, given how sudden and destructive it can be.

The cause of the failure can be natural (e.g., earthquake) or due to human error (e.g., design flaw).3 In September 2023, two dams in Libya failed due to heavy rains from Cyclone Daniel. As a result, thousands of people died—estimates range from 4,000 to over 11,000—and several officials were jailed due to allegations of mismanagement, negligence, and other mistakes that led to the dam failures.6

The loss can also result from an intentional act, such as the destruction of the Kakhovka Dam in southern Ukraine in June 2023. After the dam walls—over 60 feet (18 meters) tall and more than 100 feet (30 meters) thick—were destroyed by an explosion, a wall of water rushed downstream, causing widespread damage.7

Land Use Changes

Urbanization and deforestation significantly impact the likelihood and intensity of flooding events. Natural landscapes like forests and wetlands act as sponges, soaking up excess rainwater. However, replacing these landscapes with impermeable surfaces like asphalt and concrete increases runoff, contributing to more frequent and severe flooding.

One recent US-focused study concluded that a 1% increase in the amount of land paved over in a city—for new roads, sidewalks, or parking lots—can result in a 3.3% increase in the annual flood magnitude of nearby waterways.8

Flooding and Climate Change

According to many in the scientific community, a warming climate will continue to intensify adverse effects such as flooding.

The most recent comprehensive report released by the Intergovernmental Panel on Climate Change (IPCC)—the Sixth Assessment Report—explicitly states an increased risk for coastal and other low-lying cities and regions. An intensification of tropical cyclones9 is also expected due to increased ocean surface temperatures that fuel more energetic storms.10

flooding climate change storms
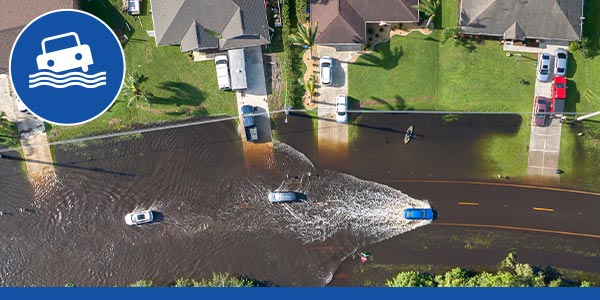
More intense storms—fueled by climate change—have resulted in more devastating flooding in coastal areas and in locations far inland.

Outside of coastal areas, an increase in the frequency and intensity of heavy rainfall due to our changing climate is also likely to occur, resulting in devastating local flooding.9 Extreme rainfall events now mean a 1-in-100-year storm is likely to occur much more frequently than every 100 years in some areas.

A recent analysis showed that in 20 of the most populous counties in the United States, a 1-in-100-year precipitation event is now expected to occur about once per decade.11

It should be noted the relationship between climate change and flooding is complicated. Climate change has intensified storms, but the number of flood events has not necessarily increased.12

Flood Types

While flooding often evokes images of swollen rivers spilling over their banks, the reality is far more nuanced. Flooding can manifest in various forms, each with its unique characteristics, triggers, and impacts.

Fluvial Flooding

Fluvial, or river-based flooding, happens when rivers or streams overflow their banks. This type of flooding is usually relatively slow to develop, allowing more time for preparation. They are often the result of sustained heavy rainfall or rapid snowmelt.13

fluvial flooding river overflow
Fluvial flooding occurs when rivers overflow their banks, as seen in this image along the Ohio River in Louisville, Kentucky, USA.

Pluvial Flooding

Pluvial, or flash flooding, is typically caused by intense rainfall and is more common in dry and/or rocky areas. The lack of soil or vegetation allows water to rapidly flow across the Earth’s surface, collecting in normally dry channels. These floods can happen with little to no warning—water height (stage) can increase suddenly—and can be incredibly destructive due to their speed and the force of the moving water.3

In August 2023, unprecedented heavy rains from the remnants of Hurricane Hilary soaked Death Valley National Park in the southwestern United States, causing widespread damage from flash flooding and forcing temporary closure of the park.14 Death Valley—the hottest and driest place in North America15—typically sees an annual average rainfall of 2.15 inches (5.46 cm). On August 20th, a rain gauge in the park measured 2.2 inches (5.6 cm) of rain, shattering the previous single-day record of 1.70 inches (4.32 cm) set in August 2022.14

pluvial flooding flash flooding
Arid regions can experience pluvial flooding—also called flash flooding—when intense rainfall occurs. These events can occur with little to no warning.

Coastal Flooding and Storm Surge

When ocean waters dramatically rise and inundate coastal areas, the phenomenon is known as coastal flooding. But this isn’t just a straightforward tale of water encroaching on land; it involves a symphony of complex factors like tides, atmospheric pressure, wind patterns, and sometimes even seismic activity. Coastal flooding can be caused by high tide flooding, storm surge, and tsunamis.

High tide flooding—sometimes called nuisance flooding—can occur during high tides and sunny days. This type of flooding is tied to relative sea level rise combined with local conditions such as winds, ocean currents, and tidal conditions. Land subsidence and a loss of natural barriers have also exacerbated the issue. In fact, high tide flooding is twice as frequent now as it was 20 years ago, and it is expected to worsen in the coming decades.16

In August 2023, beaches in the area of Wantagh, N.Y. were closed when a combination of weather systems and a super moon—when a full moon coincides with the closest the moon comes to Earth in its orbit—enhanced high tides, causing significant flooding.17

Storm surge is perhaps the most dramatic and destructive form of coastal flooding. It occurs when strong winds from tropical cyclones push water toward the coast. This wall of water can rise quickly and inundate large areas, causing significant loss of life and property. The greatest threat from a large tropical cyclone is not from wind damage; it’s flooding resulting from storm surge.18

Storm surge was tied to nearly half of the deaths caused by hurricanes in the United States from 1963 to 2012. However, due to enhanced weather warnings and education efforts, only 11% of hurricane deaths since 2013 are related to storm surge.19

storm surge coastal flooding
Storm surge is perhaps the most destructive form of coastal flooding. This image shows the aftermath of Hurricane Harvey, which struck the United States Gulf Coast in August 2017.

It’s important to note that ‘tropical cyclone’—a term inextricably linked to storm surge—is a general way to describe topical weather systems. Tropical cyclones have different names depending on wind speed and where they occur:20

  • Tropical depressions are cyclones with maximum sustained winds of 38 mph (33 knots) or less.
  • Tropical storms have maximum sustained winds between 39 mph (34 knots) and 73 mph (63 knots).
  • Hurricanes have maximum sustained winds of 74 mph (64 knots) or higher. These storms are called typhoons in the western North Pacific. In the Indian and South Pacific oceans, they are called cyclones.

Tsunamis are a less frequent—but incredibly destructive—cause of coastal flooding. Triggered by seismic activities like underwater volcanic eruptions or earthquakes, tsunamis can overwhelm coastal areas with a massive surge of water that can be pushed up to 300 meters (~1000 ft) inland.21

The 2011 Tohoku earthquake—with a magnitude of 9.0—is the most powerful earthquake to ever strike Japan. It caused a tsunami with waves over 14 m (46 ft) that inundated the Fukushima Daiichi nuclear power plant, causing emergency generators to fail. Without pumps to circulate cooling water, three nuclear meltdowns occurred, and a series of chemical explosions also took place. The disaster was ultimately classified as a Level 7 event—the highest possible rating—by the International Atomic Energy Agency (IAEA); the Chernobyl disaster is the only other event to reach this level.22

Flooding Dangers and Impacts

The impacts of flooding are multifaceted, affecting everything from public health to the economy and the environment.

Loss of Life

The most devastating impact of flooding is the loss of human life, with 75% of deaths in flood disasters the result of drowning. People can also lose their lives in other ways due to flooding—physical trauma, heart attack, electrocution, fire, poisoning, and more.23

Property Damage

Beyond the loss of life, the financial cost of flooding can be astronomical. Homes, public buildings, and infrastructure can be severely damaged or destroyed. The cost for repairs and rebuilding is often billions of dollars, as seen with storms like Hurricane Katrina that slammed the Gulf Coast in 2005, causing 1,833 fatalities and approximately $108 billion in damage (un-adjusted 2005 dollars).24

flooding property damage
Hurricane Katrina devastated Louisiana in August 2005, causing over $100 billion in damage. In this image, heavily damaged homes in the Ninth Ward of New Orleans can be seen. The Industrial Canal that collapsed due to storm surge is one block behind these homes.

Pollution

Floodwaters can carry a toxic mix of chemicals from industrial sites, as well as sewage and waste, contaminating freshwater supplies and agricultural land. This can lead to health issues—such as the transmission of water-borne diseases25—and environmental degradation.

Erosion

The force of floodwater can lead to significant soil erosion, which has its own set of long-term environmental impacts. Erosion can change the course of rivers, destroy habitats, and result in suspended sediment that can degrade water quality.26

Importance of Flood Monitoring

In the face of these various threats, the importance of flood monitoring cannot be overstated. Flood monitoring systems offer real-time data and insights into various factors like water levels, velocity, and rainfall, allowing for timely warnings and immediate action. They help authorities, communities, and organizations to make informed decisions, significantly reducing the loss of life and property.

Flood monitoring data are also used for modeling flood zones to help prevent—or at least mitigate—major events from happening in the first place. Also, these data are used by insurance companies to determine flood insurance premiums.

The rest of this section covers some of the most important reasons for flood monitoring.

Public Safety

At the most basic level, flood monitoring is about protecting lives. Providing advanced warning of flood conditions allows people to evacuate dangerous, flood-prone areas.

In the United States, the United States Geological Survey (USGS) offers different ways to view data from monitoring locations around the country. WaterAlert, one of the tools offered by USGS, allows users to set up notifications for changes in water conditions based on the thresholds they choose.

Infrastructure Protection

Flood monitoring can also help protect critical infrastructure such as roads, bridges, and dams. By knowing when and where a flood will strike, preventative measures can be taken to minimize damage.

For example, there are various ways to prevent erosion around bridges during flood events. Riprap—rock placed around structures in or near the water—is one way to protect bridges; installing “V”-shaped flow deflectors is another.27

flooding environmental impact
Unprecedented flooding in the northern section of Yellowstone National Park (USA) in June 2022 caused extensive road damage.

Environmental Impact

Well-designed flood monitoring systems can also provide data that helps protect sensitive environmental areas. For example, knowing the likely path and duration of floodwaters allows for removing or safeguarding hazardous materials that could contaminate water sources.

Planning

Long-term flood data are invaluable for urban planning and the development of effective flood management policies; these data can help determine flood mitigation strategies. For example, a 2018 report from the US Federal Emergency Management Agency (FEMA) concluded that losses avoided by federally-funded riverine flood mitigation projects far exceed the money spent, with a 7x return on investment.28

Key Components of Flood Monitoring Systems

While a flood monitoring system may seem complex, it consists of only a few carefully engineered components working together seamlessly. Here’s an in-depth look at these building blocks and how they contribute to a robust flood monitoring system.

Water Level Sensors

The cornerstone of any flood monitoring system, water level sensors provide crucial information about the water stage—sometimes called gage (gauge) height—in a river or stream, alerting authorities about imminent flooding. While this section briefly reviews sensor options, our Water Level Measurement page offers an in-depth review of water level and available measurement methods.

There are two main types of water level indicators—contact and non-contact. Contact sensors are placed in the water when measuring water level. In contrast, non-contact sensors use a measurement method (e.g., emission of microwave impulses or ultrasonic sound waves) that does not require any instrument components to be placed in the water.

Contact Sensors

There are several types of contact sensors—see our Water Level page for more information. Common contact sensor options include staff gages, submersible pressure transducers, and bubblers.

Staff gages look like giant rulers attached to static structures, such as a bridge. They are one of the most common reference points used when calibrating or verifying electronic level sensors; a reference point is a must-have when using a level sensor.

water level measurement contact sensors
Staff gages look like giant rulers that are used to measure water level. This image is from a canal in Din Daeng District, Bangkok, Thailand. Staff gages are one of the most basic water level indicators in use today.

Submersible pressure transducers measure level by calculating the pressure exerted on them from the water column above—the more water above the sensor, the greater the pressure. There are two types:

  • Differential sensors are vented to the air via a vent tube, allowing the overall measurement to be automatically compensated for barometric pressure. Examples of differential sensors include the WL16 and WL450 pressure transducers and the EXO1/EXO2 multiparameter sondes with the vented option.
  • Absolute pressure transducers are not vented, so the pressure reading from the transducer reflects both the barometric pressure and the pressure attributed to the water column above it. Data can be adjusted to remove the influence of barometric pressure if an external barometric pressure sensor is used, but this requires additional steps.

Submersible pressure transducers are easy to use, relatively inexpensive compared to other options, and can be installed in various applications; for these reasons, they are a popular water level sensor. However, they have a shorter lifespan than other sensor types because the entire sensor is placed in water, and they tend to drift (i.e., recalibration is needed). Also, pressure transducers can become clogged or damaged by debris in the water column; they are not the best choice when the water is turbulent.

flood monitoring warning streamgage station
When submersible pressure transducers are used in surface water applications, they are often coupled with another water level indicator that serves as a reference gage; a staff gage is commonly used.

Bubblers like the Amazon continuously force air from the instrument housing—located in an enclosure on the stream or river bank—through an orifice line that runs to the middle of a stream. A pressure sensor in the instrument housing records the pressure required to push the air out of the line, while an onboard barometer automatically compensates measurements for barometric pressure.

Bubblers are not placed in the water column, thus reducing the risk of premature sensor failure and damage to the sensor from debris. Therefore, bubblers tend to last longer than submersible pressure transducers. There are very few drawbacks to bubblers, although there is potential for the orifice line to become clogged.

water level bubbler flood monitoring
A bubbler can be used to determine gage height. The instrument housing is placed in an enclosure (e.g., a streamgage station). The orifice line is fed through a conduit and goes from the instrument to the water. The end of the orifice line must be secured to ensure accurate data is collected.

Non-Contact Sensors

There are two types of non-contact sensors YSI offers, both installed above the water’s surface.

Radar sensors like the Nile and WL900 use microwave impulses emitted by an antenna. The instrument measures the time required for the impulses to be received by the radar system after reflecting off the water’s surface.

flood monitoring system radar water level
The YSI Nile Radar is a non-contact sensor that uses microwave impulses emitted by an antenna. The instrument measures the time required for the impulses to be received by the radar system after reflecting off the water’s surface.

Ultrasonic sensors like the WL705 use ultrasonic sound waves—these require a medium to pass through, unlike microwaves—to determine the distance from the face of the sensor to the surface of the water by timing how long it takes the signal to return.

Non-contact sensors have an advantage over contact sensors because no part of the instrument needs to be in the water. This makes non-contact sensors safer for those who maintain them, and there’s no significant concern about sensor damage due to debris and flood conditions. It is for these reasons that many professionals prefer non-contact sensors.

It should be noted that non-contact sensors are susceptible to vandalism and damage from wind/severe weather events. They must also be calibrated to measure the water level accurately and eliminate interferences.

flood monitoring expert application consulting

Water Velocity and Discharge Sensors

Knowing how fast water is flowing (velocity) and its volumetric flow rate (discharge) can be just as crucial as knowing how high the water level is rising. Therefore, some flood monitoring systems measure water velocity and discharge in addition to level.

Velocity and discharge represent the culmination of various factors, such as rainfall, snowmelt, channel morphology, and even human activity like dam releases. Instruments that measure these parameters can yield powerful insight into how much water is being transported by the river at any given time, which is crucial for assessing flood risks and managing water resources.

ADCPs, or Acoustic Doppler Current Profilers, are indispensable tools during flood events, providing real-time insights into flood dynamics. These instruments use acoustic signals to measure water currents and velocities with remarkable precision, offering hydrographers and water resource managers vital data for flood management.

floodwater monitoring acoustic doppler current profiler
A RiverSurveyor-M9 ADCP capturing crucial data during Hurricane Florence’s historic rainfall in September 2018, helping to understand and mitigate the flooding impact in the Carolinas (USA). Photo courtesy of the USGS.

ADCPs operate on the principle of the Doppler shift, emitting acoustic signals into the water and analyzing their reflections off suspended particles or sediment. This technology allows hydrographers to map the velocity profile of water bodies from surface to bottom. During a flood, this information is invaluable. It helps them understand the speed and direction of floodwaters, identifying potential inundation areas and predicting how quickly the floodwaters are advancing.

The multi-frequency RiverSurveyor-M9 is an example of an ADCP used by top water monitoring agencies worldwide. Hydrographers use collected data to predict floodwater movement, assess breach risks, guide evacuations, and refine flood modeling. In doing so, they play a heroic role in safeguarding lives and communities during floods, demonstrating the synergy between advanced technology and human expertise in the face of nature’s destructive forces.

water flow measurement river discharge current profiler
ADCPs like the SonTek-RS5 (pictured here) measure river discharge, the volume of water flowing past a specific point in the river over a set period.

Check out our webinar on River Discharge Data From Around the Globe to see some unique applications and discharge data from sites experiencing record-breaking floods to a desert wash amid an extreme drought.

ADCPs, like the M9 and RS5, are designed to be used during various flow conditions to measure discharge at differing stage values. They are tools for building a stage-discharge relationship that can be used for predicting flood stage. The stage-discharge curve or ‘rating curve’ for a given site can be a great tool for flood warning. However, hysteresis will cause this relationship to break down. Hysteresis is common in river systems with flat sloped longitudinal profiles. When this occurs, it is critical to include additional data to better understand the rating curve. Using velocity in addition to water level can help further refine a rating curve when hysteresis* is present.

* In the context of flood prediction, hysteresis refers to the delay and non-linear relationship between rainfall and the resulting rise and fall of water levels in rivers or streams. This delay can be due to factors like soil saturation and river channel characteristics, making it challenging to precisely predict flood responses based solely on current rainfall rates and/or river stage.

Other options for measuring velocity include the SonTek-IQ and SonTek-SL, both continuous monitoring systems. The main advantage of these instruments is that they measure velocity and level. These are often referred to as ADVMs, acoustic Doppler velocity meters, comprising beams for measuring 2D velocity and water depth. The vertical beam on an ADVM sends a series of pulses and waits for a reflection from the water’s surface. The instrument converts the reflection time to a distance based on the speed of sound in the water at the site; this depends on temperature (measured with an integrated sensor) and salinity (user-defined).

The key differences between the SonTek-IQ and SonTek-SL:

  • The SonTek-IQ is bottom-mounted and ideal for monitoring flows in canals, culverts, pipes, and natural streams.
water flow velocity discharge measurement system
In this image, a SonTek-IQ measures velocity and stage in an open channel in Italy.
  • The SonTek-SL is designed for side mounting on bridges, canal walls, or riverbanks, making it ideal for coastal areas, ports, rivers, and irrigation.
water velocity flow monitoring system
The SonTek-SL, affectionately known as the Side-Looker or “S.L.,” is designed specifically for side mounting on bridges, canal walls, or riverbanks.

The primary disadvantages to acoustic instruments are 1.) their relatively high cost compared to level-only measurement systems and 2.) their susceptibility to fouling. Therefore, acoustic sensors might not be the best choice if measuring only level, but if level is the secondary aim and flow is a priority, these sensors can’t be beat.

Data Collection Systems

The data collected is only as good as its accessibility! Data collection systems typically have:

  • A data logger and telemetry unit, such as the Storm 3 Data Logger that allows data to be transmitted via cellular modems and GOES satellites.
  • Collected data can be transmitted to a cloud database solution like HydroSphere. Authorities can view this real-time data and respond to flooding events quickly and appropriately; the data must be presented in a clean and meaningful that can easily be acted upon! Those who use a river for recreation—kayakers, anglers, and others—also often need real-time gage height data to ensure the river level is safe and appropriate for their activity. HydroSphere features an escalating alarm system as various thresholds are met/surpassed.

Interested in a custom solution that meets your needs? Check out our TurnKey Data Collection Systems!

real time flood monitoring data collection system
Real-time flood data can be seen on cloud database solutions like HydroSphere.

Power Supply

While often overlooked, a reliable power source is vital for the uninterrupted functioning of a flood monitoring system. Backup power options like solar panels and long-lasting batteries ensure that the system remains operational, especially during extreme weather conditions when it’s needed the most.

Flood Monitoring System Considerations

Additional Instrumentation

Weather Station (Rain, Wind Speed): A weather station (e.g., the WE900) can supplement flood data—and even help predict where flooding may occur—by providing critical information about the current meteorological conditions, such as wind speed, temperature, and rainfall (e.g., the H-3401 rain gauge).

Water Quality: The primary purpose of many flood monitoring systems is to keep people safe by providing flood alerts when water levels rise. However, there is sometimes a need for water quality instruments (e.g., YSI EXO sondes) that measure parameters like pH, turbidity, dissolved oxygen, conductivity, and nitrate, as these systems can provide important supplemental data, especially for understanding the environmental impact of a flood event.

YSI offers TurnKey Solutions and water quality monitoring data buoys and platforms for your flood alert monitoring needs. For example, the DB600 is a rapid-response option during storm events, as it’s smaller and can be more easily deployed than other buoys.

flood monitoring expert application consulting

Number of Flood Monitoring Systems

Flood monitoring is generally a network of sensors deployed over a wide area (e.g., county), not just a single point.

Imagine a single flood detection system on the portion of a river that’s just emerged from the mountains. Even if there has been no rain where the flood monitoring system is located, a sudden surge of water could appear due to an intense rainfall far upstream, high in the mountains. This demonstrates the need for river system-wide data (i.e., a flood monitoring network) to provide adequate warnings to residents. Regardless of the lay of the land (e.g., mountains, valleys, plains, etc.), having a more expansive solution than a single flood monitoring station is critically important.

Other Sources of Data

Data from flood monitoring systems are often coupled with other sources of information to obtain a more complete picture of what’s occurring in a watershed.

For example, the United States Geological Survey’s (USGS) National Water Dashboard provides information from over 13,000 real-time stations, including stations that are part of the USGS streamgaging network that provide invaluable data on streamflow conditions nationwide. These data are publicly accessible and can be integrated into a flood monitoring system for a more comprehensive view of what’s going on.

streamgage water flow measurement station
This image shows one of two continuous flow measurement stations in the San Jacinto-Brazos and the Brazos-Colorado Coastal Basins. Streamgage stations like these are typically equipped with at least a water level sensor and a datalogger, although other instruments (e.g., a water quality sonde) are often present. Read more about these particular stations in issue #4 of Mission: Water.

Importance of Accuracy

It’s crucial to choose sensors and systems that provide accurate data. Inaccuracies can lead to poor decision-making during critical moments.

Quality and Robustness

When purchasing a flood monitoring system, the integrity of each component determines the overall effectiveness of the system. These are not just pieces of equipment; they are the sentinels that stand between us and potential disaster. Investing in quality components isn’t just good practice; it’s imperative for safeguarding lives, property, and the environment.

The instruments must be rugged enough to handle challenging flood conditions, and the flood monitoring system must be installed at an appropriate site. Sure, a stream might only be six inches deep during normal conditions, but what happens when the stage is 15 feet with floodwaters carrying enormous logs with it as it rapidly flows downstream? Simply put, the instrumentation and design of the site must be built right to live through the event and be ready for the next one.

flood conditions flood monitoring system
Flood monitoring instrumentation must be rugged enough to handle challenging flood conditions. This image shows flood conditions in Australia in March 2022.

What Is the Best System for Me?

The ideal flood monitoring system will depend on the exact application, site conditions with and without flooding, personal and organizational preferences, structures around the site, data requirements, and more. For help, ask our experts or schedule a free virtual consultation today. Our goal is to give you confidence that your flood monitoring system will work flawlessly when you—and your community—need it most.

flood monitoring expert application consulting

Our team has experience designing and installing a wide variety of flood monitoring systems for different flooding applications, including:

  • River flood monitoring systems in many locations. See how our instrumentation is used by California’s Zone 7 Water Agency.
  • Road and urban flood monitoring systems help local authorities know when to close roads due to floodwater.
  • Stormwater monitoring, including storm drains—check out our Stormwater Solutions page!
  • Coastal monitoring—check out how our monitoring instruments are used in a unique flood control system in Terrebonne Parish, Louisiana. You can also read our blog on Flood Monitoring for Coastal Resilience.
  • Flash flooding in the desert.
  • Railway track flooding alert systems allow personnel to see if trains should slow down as they approach flooded tracks, ensuring safe, efficient use of the route.

Conclusion

While meteorological data can predict potential flooding, real-time flood monitoring provides current, localized information that can help authorities take immediate action. It complements broader data sets and predictions, offering a laser-focused understanding of what’s happening in a specific area.

Simply put, flood monitoring isn’t a luxury—it’s a necessity. With advancements in technology offering more precise and real-time data, we’re not just watching water rise and fall. We’re staying ahead of the curve, minimizing damage, saving lives, and protecting entire ecosystems. In a rapidly changing world, a flood monitoring system serves as a fundamental pillar of resilience against the unpredictable elements of nature.

Sources:

  1. National Geographic, Flood
  2. National Flood Insurance Program, Flood After Fire Fact Sheet
  3. National Weather Service, Flood Related Hazards
  4. Indiana University Bloomington, Rain-on-snow: I'm melting!
  5. University of Alaska Fairbanks, The December 2020 Landslide Events in Haines, Alaska
  6. PBS, In Libya, 8 officials jailed for potential negligence following catastrophic dam collapse
  7. The New York Times, The Never-Ending Nightmare of Ukraine’s Dam Disaster
  8. Scientific American, Expanding Paved Areas Has an Outsize Effect on Urban Flooding
  9. IPCC, Climate Change 2023 Synthesis Report
  10. NOAA, How does the ocean affect hurricanes?
  11. CNN, Extreme floods are happening way more often than federal data would suggest, analysis shows
  12. The New York Times, How Is Climate Change Affecting Floods?
  13. USGS, What are the two types of floods?
  14. National Park Service, Death Valley National Park remains closed, all visitors evacuated
  15. National Park Service, Death Valley Weather
  16. National Ocean Service, What is high tide flooding?
  17. CBS New York, Jones Beach closed to swimming due to high tide floods and rough waters
  18. NOAA, Storm Surge Overview
  19. Associated Press, New study finds far more hurricane-related deaths in US, especially among poor and vulnerable
  20. NOAA, Tropical Cyclone Climatology
  21. International Tsunami Information Center, Where Will the Water Reach?
  22. BBC, Fukushima disaster: What happened at the nuclear plant?
  23. WHO, Floods
  24. National Weather Service, Hurricane Katrina - August 2005
  25. EPA Victoria, Health risks from floodwaters
  26. National Geographic, The Many Effects of Flooding
  27. FEMA, Hurricane and Flood Mitigation Handbook for Public Facilities | Fact Sheet 1.4: Bridges
  28. FEMA, Natural Hazard Mitigation Saves Interim Report